
Ironman Bike Split Calculator
Alan Couzens, MS (Sports Science)
Nov 5th, 2014
Over the course of a decade of coaching Ironman athletes, I've accumulated a lot of race files from each of the major events. In an effort to put that data to good use, I've started to compile them into a database of power, speed, athlete details and divisional rank for the various courses. This will remain a work in progress but I figured that I would share some of the trends from the races that I have observed so far, in the hope that you can use this information to make better choices when it comes to selecting the right race for your goal/performance level and personal strengths and weaknesses.
In the midst of compiling data over the weekend, I posted a chart similar to the one below on Twitter. The chart shows the regressive power curve for 7 of the major U.S. races, plotting watts per kilo versus bike split (in hours)
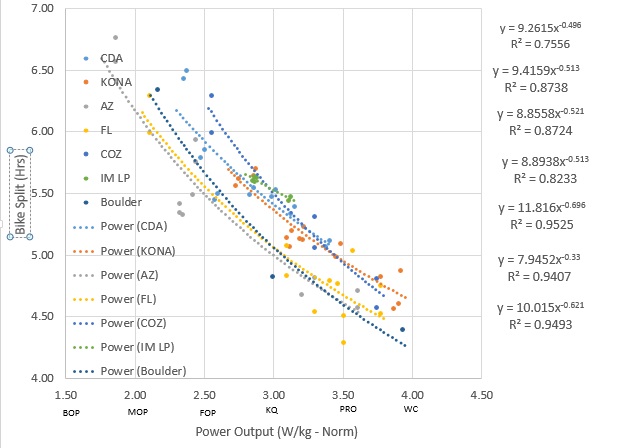
Just eyeballing the data, a few trends are evident...
- Arizona and Florida are fast courses!-- 20 - 30 minutes faster than hilly courses for typical FOP AGer output, though Florida is a bit more of a crapshoot - some years (low wind) are significantly faster than AZ, some (windy) years are slower.
- Boulder and Cozumel are fast if you are fast!-- As an altitude course, Boulder offers less air resistance to the athlete at faster paces and therefore rewards fit, fast athletes. Cozumel, being an often windy race, rewards those athletes who are able to stay in the 'main pack' of racers. If you are off the back, facing a headwind portion of the course, speed:power will take a significant hit on this course
- (Somewhat surprisingly) stronger cyclists appear to do slightly better on flatter courses-- This may be related to the pack dynamics & wind that is more typical on flat courses, but athletes 'who can hang' tend to go faster when the course is flat. For example, the difference between 2w/kg and 4w/kg output on LP modeled to a 30% difference in speed. On Arizona, it led to a 31% difference for the faster athlete
To make the data more practically applicable, I built a calculator that spits out a bike split prediction for a given watts/kg on the various courses (below)
| Weight (kg) | |
| Race Power (norm) | |
| Race |
Predicted bike split: hrs
A couple of caveats when looking at the data/calculator. While, I have 400+ Ironman race files, this sample contains 84 files (average of 12 per event). Some events are better represented than others (e.g. Boulder which is in its first year). I will continue to add files and races to the database so be sure to check back here over coming months.
Of course, the trend lines and predicted splits are based on average conditions across the years. If you hit an unusually windy or calm year, the predictions won't hold. That said, the high correlation coefficients across multiple years suggest that the model is relatively stable, at least for most races
Related to the above, the model assumes that you have average dimensions for a given weight, or at least average within my data set (mean BMI=23.2). If you're 5'0" and 80kg, the model won't hold. Similarly, if you ride with a 'Kienle-esque' position and have a very low CDA for your size, you will be faster than the predicted split
The above limitations withstanding, hopefully you find the calculator useful in selecting the right race and setting realistic goals/expectations for the season ahead
Race smart,
AC
Tweet**************************
Don't miss a post! Sign up for my mailing list to get notified of all new content.
**************************