
The impact of Kona conditions on race performance.
Alan Couzens, M.S. (Sports Science)
Oct 13th, 2016
Well, another year of the Ironman World Champs in Kona is in the books. In many ways, a typically tough year on the Big Island – as the copy on the broadcast goes – one of the toughest places in the world to race. But, in this case, that’s not just sensationalism. Kona really is an incredibly tough environment to race 140.6 miles in. From the high temperatures that reflect from the lava rock to the wind that sweeps relentlessly across the barren landscape to, perhaps the toughest element of all – the saturating humidity of the place, Kona really is a race in which the environment is every bit as much a rival as your competition &, it’s an environment where, realistically, you have to be willing to give up some of your normal performance numbers to these conditions. This was a point made by this year’s winner, Jan Frodeno in his “Breakfast with Bob” interview embedded below (well worth a listen!). He makes those comments at about the 8 min mark
Jan says…
“You have to come here at your very best game, prepared as well as you can be, and then pretend to race at altitude. You’ve just got to be willing to give an extra 10-20% to the conditions.”
Frankly, I thought that this is a brilliant way of viewing the race! -- Even when fitness is very high and the athlete is fully prepared for the heat and they fuel/drink optimally, athletes should still expect their output to be somewhat compromised by the conditions.
In my own experience in preparing athletes for the Kona conditions, I have always encouraged athletes to expect performances towards the lower end of the projected range. But I had never gone that extra step of actually quantifying this impact of Kona conditions on performance. Until now….
Below you’ll find data from the previous 3 years of my crews' Kona racing that compares the average percentage of efficiency factor (power/HR & pace/HR) for race day performance for the team compared to the average training E.F. from the month leading in. This directly attempts to answer that question that Jan posed – just how much performance do athletes need to expect to “give up to” the Kona conditions.
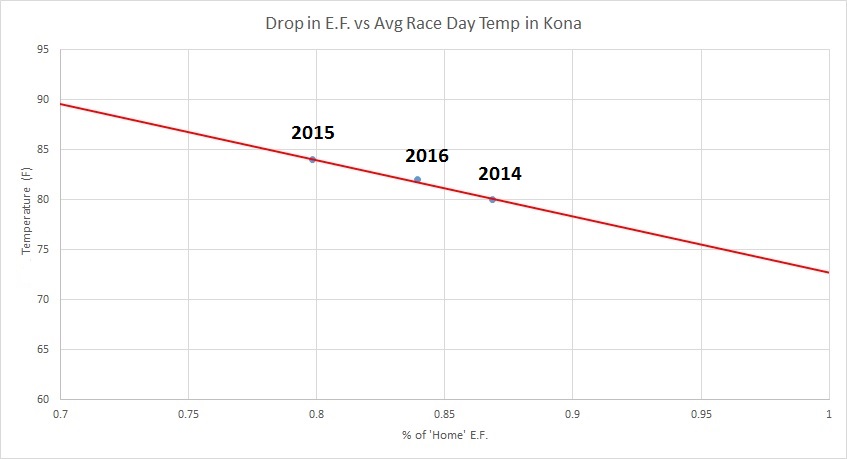
The 3 years (2014, 2015, 2016) have spanned a fairly normal range for Kona, with average temps ranging from 80-84 degrees F, max temps of 86-89 degrees F and mean humidity numbers of 64-67%. 2015 was the hottest of the years at 84F avg temp and 89 max. 2014 was the ‘coolest’.
In looking at the results, Jan’s ‘give up 10-20% to the conditions’ rule holds up pretty well. The mean drop in E.F. compared to home training numbers from the month before was 17%. In other words, if the athlete’s home E.F. was 2.0, they could expect to race at an E.F. of ~1.7.
The range across years was 13% in the coolest year (2014), i.e. 87% of the home E.F. training numbers to 20% in the hottest year (2015 - 86 degrees F) with 80% of the home E.F. training numbers.
Below you'll find a calculator based on the above data to show the drop in pace/power that you can expect for different conditions. Just enter your normal 'home' E.F. numbers from recent training, along with your target heart rate for each for the race, and slide the slider to the temperature in Kona to see the drop in pace/power you can expect.
| E.F. | Heart Rate | Predicted Power/Pace (vs home) | |
|---|---|---|---|
| Normal Bike: | |||
| Normal Run: | |||
| Temperature: | 73F (100 %) |
Across disciplines, the run was significantly more condition affected than the bike, with an average loss of 20% (80% home EF), compared to 14% (86% home EF) on the bike. This was also more affected in the extreme year, with a mean drop to 70% of home run E.F. numbers for my crew in 2015. In other words, if athletes were normally running 7:30’s at race heart rates back home, they were jogging 9:45’s on the Kona course in 2015! It was not a good year.
The above adds some further context to that relationship between race day power/pace vs training power/pace. While the ‘rule of thumb’ in cool weather races might be to expect ~5% decoupling across the bike, & potentially, a further 5% across the run for a race day average somewhere in the 5-10% mark, it is clear that in more challenging conditions like Kona, these rules no longer hold.
I will keep adding data from previous races to this to assess how different conditions, both in Kona and in other races, both cooler and with less humidity, compare in how much the conditions reduce training numbers. I'll be interested to see how cooler races stack up. The trendline on the chart suggests that it would take a 73F race day to equal training numbers. There aren't too many of those around but it will be interesting to throw in a bit of data from those high 70's F races
The standard deviation of the above data was 10% on the bike and 13% on the run. This makes sense considering we’re dealing with a bunch of different variables in addition to the heat - humidity, size of the athlete, absolute output, time of acclimation, fluid intake etc. Given this multitude of (probably non linear) variables, it makes a lot of sense to me to build up a neural network to come up with a predictive model of what race time an athlete should expect given fitness coming in and a given combination of all of the above variables. I will be working on that over coming weeks.
But, in the meantime, hopefully the above data adds some useful context on what to expect from yourself or your athletes on race day &, just how high ‘cool fitness’ needs to be in order to pull out a competitive result in Kona conditions. In the words of Jan – come in at your very best game.
Train (& race) smart,
AC.
TweetDon't miss a post! Sign up for my mailing list to get notified of all new content....