
Identifying Load Limits
Alan Couzens, M.S. (Sports Science)
Nov 18th, 2015

At this time of the year it’s easy to get carried away with the ‘no limits’ mindset. This goes along with the over-riding theme of this month on the triathlon Calendar – #DreamingSeason. Heck, I might have even contributed to it with my last post. But, before we get carried away with enthusiasm, it is important to make a realistic appraisal of those 2 key limits that can stop us in our tracks on our journey towards big goals: Time and its related counterpart – energy.
A key 'first step' in setting realistic goals for the season ahead is having an accurate understanding of the relationship between training load and fitness for a given athlete. However, it is also essential to understand the flipside of this - the relationship between training load and fatigue. While it might be nice to assume that if we just keep pouring training load into an athlete, performance will increase, deep down we know this is not the case. There are limits - load limits. Training load is only useful if that athlete can actually do it in a meaningful way and stay healthy while doing it! In order to prescribe training load effectively, we need to know where this 'breakpoint' resides for a given athlete
We don’t live in a vacuum (or a national training center :-) so energy is a moving target, influenced by all of those things that come along with being a ‘real life’ athlete – sleep, work stress, family etc. but, for the serious athlete, the impact of your training load on your energy can’t be denied and it is, in my experience, very useful, from a planning perspective, to 'get to know' this relationship of how an athlete's energy for (& attitude towards) training changes in relation to changes in training load (or the rate of increase of training load) over a period of time.
My preferred way of tracking this relationship between energy and training load might be surprising in its simplicity given my 'tendencies'. At the risk of losing my 'card-carrying quant' status, here it is…
A simple 1-10 session rating….
1 – Dead Tired. Couldn’t get out the door.
2 – Not happening. Didn’t even have easy in the legs/arms.
3 - Easy was OK but main set wasn’t happening.
4 – Not great. Got it done but it felt like work.
5 – Average.
6 – Felt good.
7 – Strong. Good energy
8 – Fantastic. Felt easy
9 – Had to hold back. Legs wanted to go!
10 – One of my best!
That's it. At the end of each session, jot down where your energy fell on that 1-10 scale. This could be as simple as something like jotting down a number in your notes. In terms of easier access to the data, Training Peaks offers a similar feature in their 'metrics' tracking section that you can pull into an excel sheet via their csv export for you or your athletes. I personally coded up a slider scale for this metric in the web app that I use for my athletes to enable me to easily pull down the long term data programmatically. But whichever way you do it, there is huge value in terms of identifying 'how much is too much' by simply watching how this ranking changes, in accordance with training load, over time.
In the midst of serious training, daily energy will, of course, wax and wane, sometimes in an unpredictable way due to extraneous factors. This isn't to say that observing (& acting on) day-to-day energy changes is useless, not at all! However, this 'how I'm feeling' metric really comes into its own when we track the athlete's average feeling over a period of time (I like a 7 day rolling average).In doing this, we can identify in a 'mesocyclic' sense, when an athlete is in a hole and needs some recovery. Or, even better, we can proactively look at the athlete's previous training data and plan the loads accordingly so as to avoid these 'deep holes' in the first place!
So, how much is too much? Or how deep is too deep? Common sense would tell us that we want the average session rating to score, well, ‘average’. 4’s are par for the course for serious athletes. Short periods of 3’s are OK at certain points in the year but..
... when the athlete starts bumping up against 2’s…
a) Our training load is (by definition of the '2') compromised
b) The athlete's training response is likely compromised (something I'll talk about in a future post)
c) The risk of injury and illness is greatly increased.
Bottom line, to keep athletes healthy, responsive and to stay ‘on plan’ we want to keep most of the year at 4,5,6 &, in an individual planning sense, a key objective is to identify the training load & ramp rates for that person that keep us in this 'green zone'.
As I suggested above, and as other studies have suggested, the ramp of training load or the difference between the athlete's long term load and short term load is a key factor in how tired a given load makes an athlete (& a key factor in injury risk!). After all, a 30hr week is an entirely different proposition for a pro triathlete vs a recreational athlete whose standard week is 10hrs. This gap between long term and short term load is quantified in Training Peaks in the Training Stress Balance (TSB) number (click here to read more about this and other TP/WKO+ metrics)
Here is an example showing how we can visualize this relationship between the - training load ramp (TSB) and the impact it has on the athlete (the 7 day average session feel) for one athlete that I work with over the course of a season, with TSB on the x-axis and 7 day rolling average of session ‘feel’ on the y-axis.
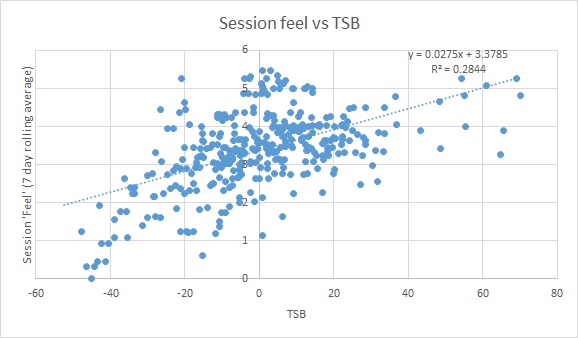
A few things are clear...
1. As 'freshness' (TSB) increases, athletes tend to feel better during sessions. Not exactly an earth-shattering revelation but an important one to keep in mind through the year.
2. Athletes of mine tend to rank themselves as 'somewhat tired' through most of the year. Sorry, that's the reality of serious training. Or, in the words of my buddy, Gordo, "Getting tired is the point" :-)
Lastly, and of more practical significance in answering the qu of 'how tired is too tired?', for this particular athlete, things start to head south pretty quickly when TSB falls below -20 (a ramp rate of ~10 per 4 week block), with session ratings consistently in the “Not happening” or “Dead Tired” ranges at TSB’s below -30 and, on a related note, almost all “Feeling Good” ratings occurring at positive TSB numbers.
The practical 'take aways' that come from understanding this relationship for this particular athlete when building the Annual Plan are plainly evident…
- To manage risk and keep the training rolling along in a relatively safe manner and avoid the 'dead tired' & 'not happening' days', while slowly and consistently building the athlete's base, we want to plan the ramp of our training load in each block to keep the TSB higher than -30, with -20 being a safer ‘floor’ during this period.
- When main set quality becomes important for key or ‘breakthrough’ workouts, we want to keep TSB numbers higher still, closer to zero for those weeks. We certainly don’t want that athlete feeling that "the mainset isn’t happening" on those key (confidence building) sessions!
- Assuming we want to maximize our chances of this athlete “feeling good” for their key races (we do!), we also want to ensure that TSB is positive (and looking at that ‘batch’ of high numbers, probably in the 0-10 range) in the 7 days leading into their key events.
It should be emphasized that while the principles hold across the board, the particular numbers mentioned above are specific to this athlete. Athletes with more 'life stress' may see "Not happening today" days occurring with lower 'training stress' i.e. at higher TSB numbers. That's OK. Far better to be aware of this relationship & have a slower consistent ramp than to dig so deep into the energy stores that you make yourself sick, injured or compromise your long term progress & enjoyment of the sport!
By bringing together qualitative and quantitative assessment in this way, we get the best of both worlds in determining individual load limits for our athletes. All coaches who've been in the game for any period of time know that there is a lot of hidden value in the subjective comments of athletes. The big challenge for the evidence-based coach has always been to accumulate and manage this less conventional ‘data’ in a meaningful way. As machine learning continues to progress, systems will come along that can pull this text from athlete comments automatically (& maybe even assess the positivity of ‘coach sentiment’ along the way :-) but for now, a simple ‘slider scale’ is a great starting point to assist you in planning the right load to keep your athletes happy & healthy.
Train smart,
AC.
TweetDon't miss a post! Sign up for my mailing list to get notified of all new content....