Geeking out on HRV: The advanced stuff
Alan Couzens, MS (Sports Science)
Feb 12th, 2015
This is part of a 5 part series on using Heart Rate Variability to guide your training. You can find part 1 here, part 2 here, part 4 here & part 5 here.
After my last post on heart rate variability, I had some questions on what “all the other stuff” on Kubios is – what it all means and whether I should track any of it?
You’re asking me if you should track more numbers? Predictable response coming up… :-)
Seriously, there is, definitely, some added value to the additional metrics provided by Kubios. In particular, the metric termed SDNN – or the standard deviation between normal beats. This is highlighted in the screenshot below…
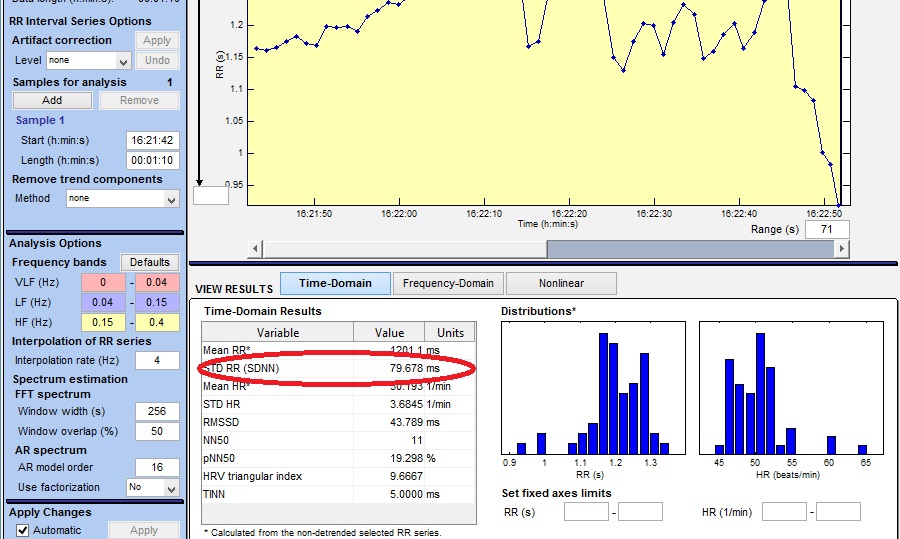
If you record your SDNN numbers in a similar manner to what I suggested for RMSSD in the last article, you’ll find something interesting. While, when you’re generally really tired, both numbers will read low, on certain days your SDNN numbers will fall outside the ‘normal range’ while your RMSSD numbers will not.
So what gives? Am I tired or not? The discrepancy between these 2 numbers has to do with the ‘way’ that you’re tired or, more specifically, what aspect of your CNS is tired and potentially not ready for training of a type that will stress that aspect.
There is some research support for the above assertion that the SDNN:RMSSD ratio reflects different ‘types’ of tiredness. Studies have shown that the ratio of SDNN:RMSSD offers some good insight into the ‘sympatho:vagal’ balance of an individual at any point in time (e.g. Otzenberger et al., 1998; Wang & Huang 2012)
You’ll remember from the last article that the vagal (or parasympathetic) nervous system is our ‘rest and digest’ system that calms the organism down to allow for growth to occur. The sympathetic nervous system, on the other hand, is all about the liberation of energy sources to deal with (real or perceived) challenges or threats. So, by looking at these 2 numbers, we get a good snapshot of the readiness of the athlete to deal with high intensity (high stress) training & low intensity (low stress) training and can use that information to help guide the programming.
Kubios actually provides a true visual ‘snapshot’ of these 2 scales in its Poincare plot, with the relative magnitude of RMSSD and SDNN shown in the SD1 and SD2 ‘crosshairs’
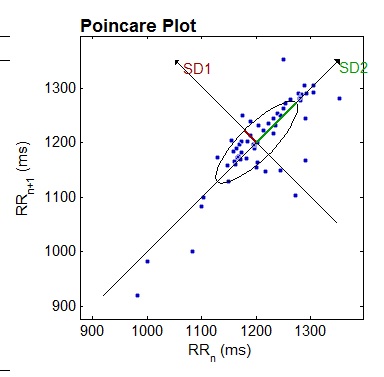
The ‘skinnier’ the Poincare ellipse (the lower the SD1 number), the more ‘parasympathetic tired’ the athlete is, while the ‘shorter’ the ellipse (the lower the SD2 number), the more ‘sympathetic tired’ the athlete is.
As you collect data over a period of time, you will develop the (very cool) ability to ‘eyeball’ the state of an athlete’s autonomic nervous system by looking at the shape of this plot!
So, what do we do when these numbers don’t line up (i.e when SD1 is still ‘fat’ but SD2 is ‘short’)?
When SDNN is low but RMSSD is still normal (relative to your mean values), energy stores may still be good, but your body’s nervous system is tired of dealing with high stress. It is important to note, that this may or may not be high training stress. It may be other life stressors. Either way, the prescription is the same - at these times, the numbers probably back up your natural desires to spend today’s training doing a good chunk of low intensity aerobic work in a de-stressing environment – an easy spin on the MTB on some picturesque trails!
At other times, RMSSD may be significantly low indicating low overall energy stores & the need for more a more complete recovery focused on sleeping and eating!
If you look at studies on different types of athletes or different types of training load, you’ll see this bias e.g. HRV studies that look at extremes of high volume training tend to show the most significant change in RMSSD. For example, a 2003 study by CP Earnest & colleagues, that tracked HRV in professional cyclists over the course of the Vuelta, showed an ~40ms drop in RMSSD in over the course of the stage race(!) This contrasts with other studies that focus on high intensity overload that tend to show the greatest changes in Total Power and SDNN (e.g. Vesterinen, 2013)
In summary, not only can HRV provide valuable insight into your readiness to accept a training load, but also the type of load that it’s ready to accept. Presumably this concept is what’s behind systems like Omegawave which attempt to discern the athlete’s state of readiness for different types of training load.
Take home points…
- If you’re going to go to the trouble of recording HRV, what’s one more number? :-)
- If SDNN is low but RMSSD is still in normal ranges, a good chunk of aerobic training is probably OK (& may, in fact, be ‘just what the Dr ordered in terms of bringing your ANS back into ‘balance’)
- When RMSSD is chronically low, the best strategy is to take a true recovery day & let the body rest (& digest)
Train (really :-) smart,
AC
Tweet**************************
Don't miss a post! Sign up for my mailing list to get notified of all new content.
**************************