
Using VO2 Scores to Benchmark Performance in Triathletes
Alan Couzens, M.Sc. (Sports Science)
Updated April 6th, 2017
The task of testing is integral to the whole training process. After all, training is a means to an end and, at least for endurance sports, a large part of that 'end' is higher and higher levels of fitness. In short, you want to know that the training is working to make you a fitter athlete(!) and the only way to do that is to test!
There are many ways to test to see if your training is making you better. There are lab tests that use lactate curves or gas exchange analysis to monitor specific physiological changes over time. There are field tests, such as Joe Friel’s 30 minute TT or Andy Coggan’s CP5/CP20 tests to approximate the athlete’s “Functional Threshold” and there are races! All of these tests have one thing in common: they hurt!
In fact, these tests hurt enough that the athlete is quite restricted in how frequently they can perform them. You may naturally think that isn’t such a bad thing. After all, how quickly do we expect an athlete to improve? And that is true, a test that is truly representative of current fitness performed every month or so is sufficiently frequent to mark changes in performance. However, this begs the question, how truly representative of a global relationship is any one measure?
This question is the domain of statistical research and it is answered by the need for a large amount of data in any research study in order to 'prove' a given relationship. It is an important consideration because it affects the level of confidence that we can have in any conclusions we make as to the efficacy of the training plan. There is a reason that studies use large samples - because with any one test there is an element of the result that comes down to pure chance. To come up with a statistically significant result, say between a given training plan and improvements in VO2max, within any reasonable confidence interval, we need a large number of measurements. While this is somewhat practical in the scientific world by recruiting a bunch of athletes, in the real world having one athlete do multiple max effort tests all within a limited time span to be confident of the relationship between a given training load or content and performance changes is less practical. If we were to submit our n=1, once a quarter tests to a journal as 'proof' of the efficacy of a given approach, we would be laughed out of the room. And for good reason! The sample size/frequency demanded by scientific research is not merely a function of the general bureaucracy of research studies, but, rather, it is indicative of the true variability of day-to-day performance that can be attributed to factors other than training load. In other words, your 'gold standard' once-a-quarter lab testing, even with perfectly calibrated equipment and perfectly controlled conditions may exhibit performance changes that may be just as attributable to day-to-day fluctuations or pure chance(!) as they are to true performance changes induced by training. It goes without saying that these non representative 'failed tests' that are the result of an 'off day' rather than a plan that's not working present a real problem for the psychologically fragile athlete (or coach! :-)
Add to this problem the significant issue of the validity of a short test in a lab as a predictor of real world race performance, especially for athletes whose event spans 8+hrs — is a 20 minute field test truly indicating changes in performance that are specific to ironman racing? And we have to truly question the benefit of infrequent short duration maximal testing as a means of assessing whether the training program is working or not. So, are we left to merely go on faith that the training program is working & wait until race day as the one and only litmus test, or is there another way?
An effective & valid benchmark/indicator of improving fitness for an ironman athlete needs to be:
- Indicative of ironman fitness (i.e. aerobic in nature).
- Sufficiently mild that it can be repeated frequently enough to indicate true performance trends!
While I do still use some short duration tests and lab tests to home in on some of the finer points of an athlete's physiology, for the reasons given above, my primary indicator of improved fitness through the season has become an adaptation of Jack Daniels' VDOT formula that enables me to use almost every workout to benchmark performance. Here’s how it works:
Couzens' VO2 Score Formulae for Benchmarking Performance in Triathletes
Even though I put my name on it, I claim very little originality here :-) Jack Daniels’ (pictured above) Running Formula uses race data to infer an athletes’ VO2max based on the race performance along with certain economy assumptions. He calls his version of the VO2 score a 'VDOT' (derived from the little dot above the V in a typical VO2max used to denote 'per minute'). He then uses this subsequent 'VDOT' to prescribe training paces based on a given percentage of max. I have simply flipped this on its head (and modified the economy assumptions based on data that is more specific to triathletes, something I talked about in this post), instead of inferring training paces from performance. I infer performance from training paces.
Here are the formulae that I use to calculate a VO2 score from a given training session for triathletes.
Bike: (W/75*1000/BW)/((THR-RHR)/(MHR-RHR))
Run: (210/P)/((THR-RHR)/(MHR-RHR))
Where:
W = Power of the session in watts (norm.)
P = Pace of the session in min/km (flat/norm.)
BW = Bodyweight in kg
THR = Training heart rate in bpm
MHR = Max heart rate in bpm
RHR = Resting heart rate in bpm
So, by applying some assumptions with regards to economy & scaling up the curve from training pace to max, we are able to get an estimation of the athlete's current VO2max (importantly) without going to max! This method is illustrated below..
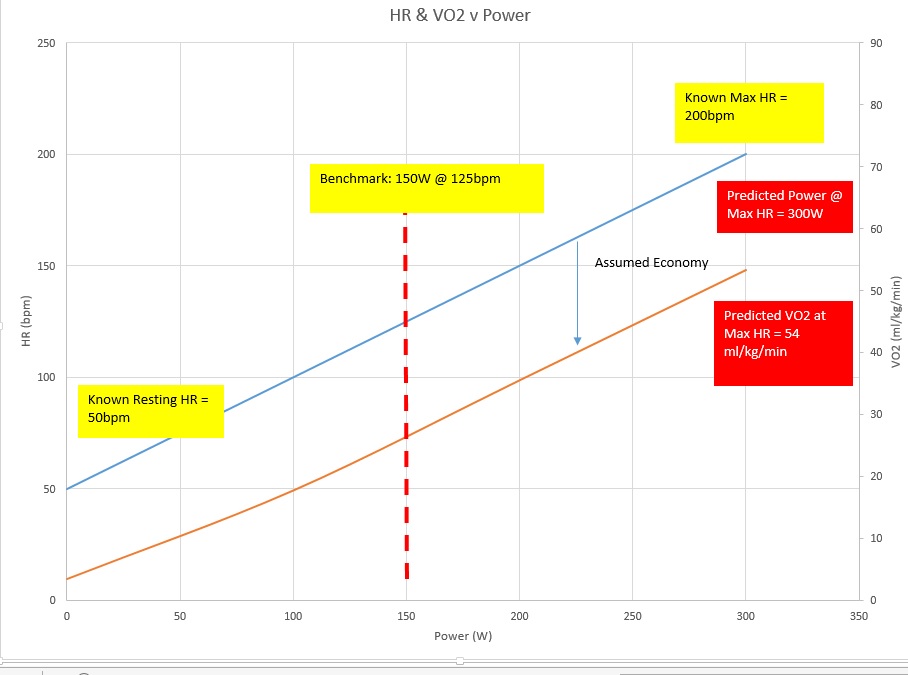
If we know resting HR and max HR, we know the slope of the HR line. If we know a power number on that HR line, we can then follow that number up the line to see what the power would be at the known HR max (as HR scales quite linearly with power during a VO2max test) . Similarly, if we make an assumption on the 'economy gap' between the power and VO2 lines, we can then predict VO2 at this max power number (as VO2 also scales fairly linearly with power up to VO2max - where it, by definition, plateaus).
The assumptions on this 'economy gap' in the equation aren't just pulled out of thin air. They come from the average economy numbers of hundreds of actual real world VO2 (lab) tests that I've overseen over the last couple of decades in the lab and (also importantly) are specific to triathletes.
These numbers differ quite a bit from Jack's economy numbers from the Daniel's Running Formula which were, presumably, based on a more runner specific sample. Jack's mean economy assumptions from his formula equate to economy numbers of ~190ml/kg/km (vs the 210ml/kg/km from my sample) As you might expect, the specialist runners in Jack's sample have considerably higher economy numbers than the averages from my own sample of (subelite to elite, generally long course) triathletes (by about 20ml/kg/km!) &, would result in a significant underestimation of VO2max if applied to triathletes!
Additionally, of course, I'm adding the opportunity to benchmark bike performances by applying the same principle and using the mean economy numbers of all bike tests performed on my triathlete sample ~75 watts per liter of O2.
Here’s an example, showing the working, that former elite triathlete, Gordo Byrn gave from his own data:
HR = Max 175, resting 40
BW = 73 kg
275w, 150 bpm (30 mins, training)
(275/75*1000/73) / ((150-40)/(175-40))
50.22 / .815
——–
61.61
=========
When Elite:
74 kg
300w (2 hrs, half ironman race)
54.05 / .815
——–
66.32
=========
The numbers that Gordo arrived at are pretty representative of what I see among pro's/elites (both in the field and the lab). Ultraman World Champions Mike & Inaki were both in the low 70's at their peak. Most of the Kona Qualifiers on the team are in the 65-70 range. These numbers & also line up well with VO2 max norms from other studies. E.g. O'Toole (1995), Sleivert & Rowlands (1996). A table of typical numbers for each level of athlete is provided below.
| Elite: | 65-75 (ml/kg/min) |
| Top AG: | 60-70 (ml/kg/min) |
| MOP: | 50-60 (ml/kg/min) |
| BOP: | 40-50 (ml/kg/min) |
| Untrained: | 30-40 (ml/kg/min) |
To see how your own numbers stack up, I've provided a quick calculator below that will spit out your VO2 'score' given weight, HR & pace/power values
| Weight: | kg |
| Max Heart Rate | bpm |
| Resting Heart Rate | bpm |
| Session Power (Bike NP) | W |
| Or Session Pace (Run min/km) | minsec |
| Session Heart Rate | bpm |
VO2 Score (/predicted VO2max): ml/kg/min
A couple of notes that will assist with analysis of your data samples:
- Usually, run will be marginally higher than bike. 67/73 would be a typical split.
- Data is only valid if sufficiently long/aerobic, i.e. increases in power are accompanied by a proportional increase in HR (efforts of 60-90min or more in duration)
You may be noticing that the way this metric is calculated also bears a striking resemblance to Joe Friel's Efficiency Factor (E.F.) metric that you can find on your session summary on Training Peaks in that we are essentially dividing power or pace / heart rate. This is completely true. However, this number has some contextual advantages over E.F. that make it very useful as a benchmark when comparing across time, across sports and across athletes:
- It takes weight into account, this can be an issue when assessing fitness by looking at pure power numbers between athletes of different sizes or the same athlete at different sizes!
- It takes individual max and resting heart rate into account. This is a big factor that makes it difficult to compare across athletes on E.F. alone, e.g. an athlete with a max of 200 who is pushing 200W at a HR of 100bpm (50% of HR max) is clearly in a different spot to an athlete who is pushing the same 200W at a HR of 100bpm but with a max HR of 120. Both would 'score' an E.F. of 2.0 but athlete A is at 50% of HR max while athlete B is over 80% of HR max. Clearly, very different levels of fitness!
- It also allows some level of assessment of “global” bike/run fitness and allows one to compare relative fitness between the two sports. While it can be tempting to do with with E.F. because the numbers are on similar scales, a bigger athlete should have a significantly higher E.F. on the bike than the run just due to the fact that for the larger athlete, power will need to be significantly greater to move at the same speed as the smaller athlete on the bike.
- And, as mentioned, most importantly it offers the coach/athlete sufficient data points to be confident of the significance of the results — that the test data is not purely the result of a good or bad day.
OK so once you have all of these benchmark numbers what do you do with them?
Well, due to the possibility for very frequent measurement, you can gather A LOT of these through the training year (almost every session!) and can compare them directly with the training (load/composition) at that point. You can very easily determine a good performance model for a given athlete of the training load:performance relationship by tracking how these average weekly VO2 score numbers change with training load over time. This is exactly what I do with the athletes that I work with. I track how these scores change through the training year and in response to different training loads so that we can predict what training load will be required to achieve previously unseen performance numbers. An example of this is shown on the chart below...
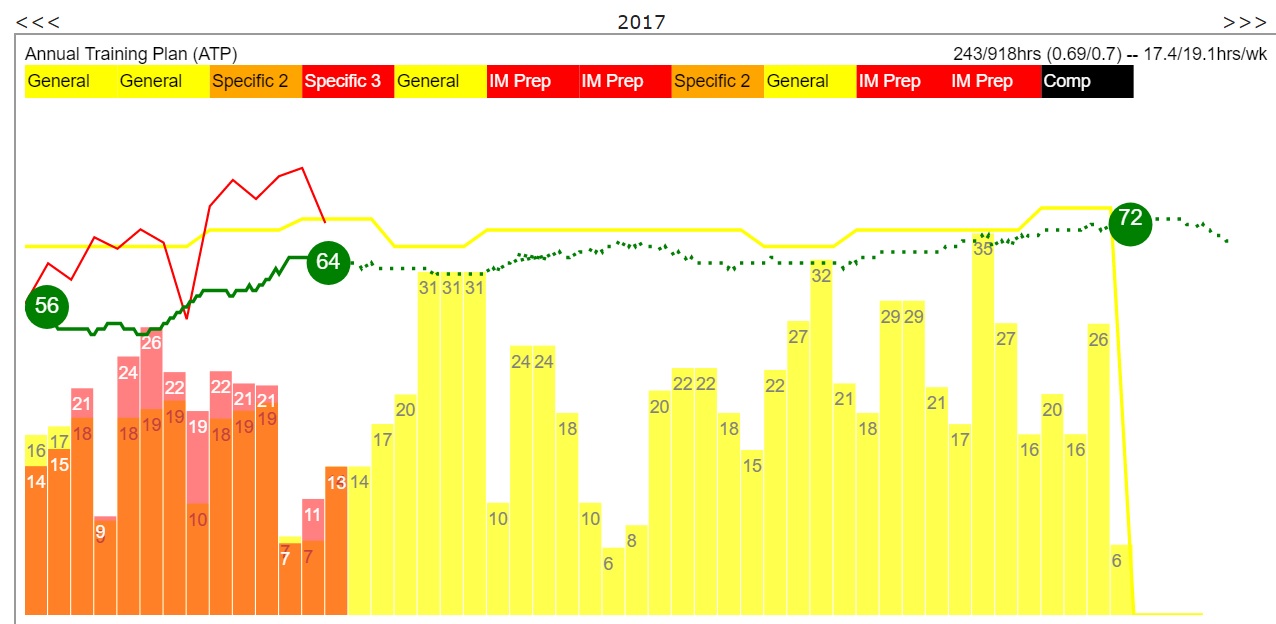
The average of the VO2 scores for each week for this athlete is shown as the solid green line. The athlete begins the season at 56 and, following a good dose of a couple of blocks of 21-26hr training weeks improves that to 64. The athlete's power and pace numbers for a given HR are clearly improving & he is responding to the work. Yay! The training is working! :-) You can also see a forecasted progression of where we expect VO2 to go based on previously observed load/performance relationships for this athlete, with a peak projected VO2 score of 72 for the 'A Race' of the year. I'll go into a little more detail about how we forecast future performance on the basis of previous observed relationships in a future post.
But, for now, I hope you find the incorporation of frequent VO2 benchmarking as a relatively painless & specific indicator of improved aerobic fitness as useful as I do.
Train Smart.
AC
TweetDon't miss a post! Sign up for my mailing list to get notified of all new content....