Python for Coaches: Part 1 -- Getting the data (fit files)
Alan Couzens, M.Sc.(Sports Science)
In the spirit of showing the benefit of coding for coaches and sports scientists, I'm going to try to share more snippets of working code so that you can play around with Python and, hopefully learn some useful tips and tricks. If you'd like to follow along with the interactive version and code along yourself, you can head here & save an interactive copy of the blog below (hosted on Google's Colab) to play with your own data)
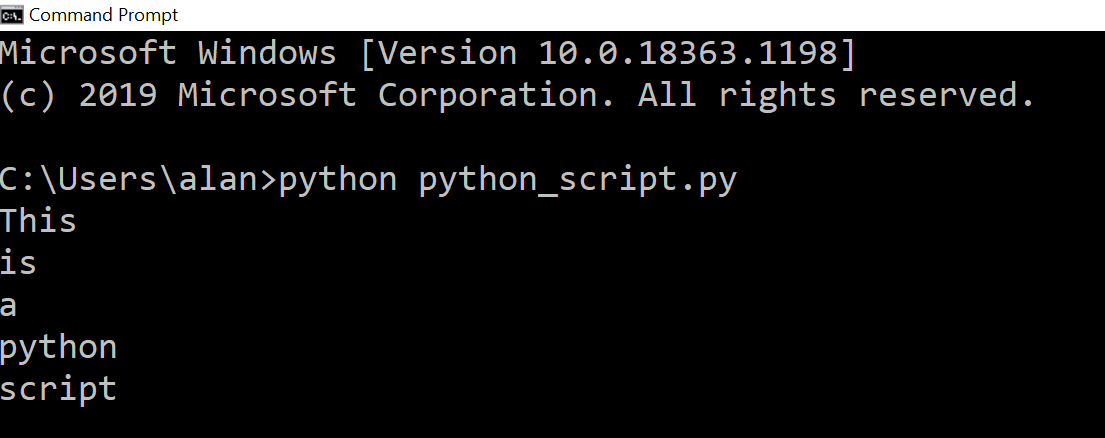
But, first things first, after you've installed Python on your machine (https://www.python.org/downloads/), there are a few different ways that you can run code. Maybe the easiest is from the command line e.g.

In the above, I start python just by typing "python" at the command prompt and then I can run any code I want directly in the shell that comes up. The shell is defined by the >>>> bit. I can type any command that python recognizes there & then hit enter and python will run it. Here I'm telling it to print "Hello World" and, after I hit enter, that's what it does.
All of the code below will work via this method. However, a better approach, when you have long sections of code that you want to run together is to write all of the code together in one 'script' and then run that script as one unit. While there are many different editors available (I use VS Code - https://code.visualstudio.com/) , you can write your code in pretty much any text editor. Here is a python script written in the run of the mill Notepad installed on just about every PC..

And then, to run it. I just go back to my command line and then type "python" and the name of the script (assuming the script is saved in the same folder that my command line is pointing to - in this case Users\alan) and python executes each line of my script.
 So those are the most common ways to run python on your machine. But, what if you don't even have Python on your machine? The environment that I'm writing this blog in (Google Colab) is a great online resource for writing, sharing and running code. It brings the script and the terminal that executes the script together in one place. All you need to do to run the code in a cell is hit the "play" icon in the top left corner of each code block...

A couple of things to note if you're following along in the colab notebook. You have to run each of the cell blocks sequentially for the code to work. So, if you're playing around and you get an error, just make sure you've run all of the preceding code blocks. So, let's get started...
The first step in doing any sort of "Data Science" is having data :-) Getting data is a strength of the Python language because it is very versatile and can work in many environments. For example, Python can talk to any files on your computer, it can talk to spreadsheets, it can talk to databases, it can talk to API's that live on the web or it can even "crawl" the web and scrape data from web sites. Each of these avenues represent viable data sources for coaches as well. Strava would be an example of a company that has a great public API that you can plug into. I'll cover how to talk to API's in a coming post. However, let's start at the beginning with data that we all have access to - workout files. In this case, we'll look at one of the most common file types - Garmin .fit files.
To do that, we're going to learn about the most powerful little secret about the Python programming language: There are some really smart dudes and dudettes programming in Python and building FREE libraries that we can plug into! This is, IMO, the biggest strength of Python. Just like Apple's "there's an app for that", when it comes to Python, there's a package for that! So let's start with the first package Python's fitparse. A package designed specifically for the task of parsing Garmin fit files. To install it (or pretty much any package), all we need to do is...
!pip install fitparse
If you click the little play icon, Python will go ahead and grab that package and install it on this runtime. Pretty cool, eh? No downloading folders & moving them to different directories and configuring paths. For most packages, that's all you have to do type "pip install" and then the package name.
OK. So, we've installed the package. Now how do I use it to read my fit file? First things first, there is a particular class within the fitparse package that defines each individual fit file as its own object. So, we're going to go ahead and import that class so that we can define our file...
from fitparse import FitFile
This class is what we're going to use to define our own fit file that we've uploaded as a FitFile object. So that we can bring in all of the cool analysis methods that make up the fitparse package on our file. I uploaded a file called 'KonaBike.fit' to the files icon in the left menu on the screen so I'm going to reference it here.
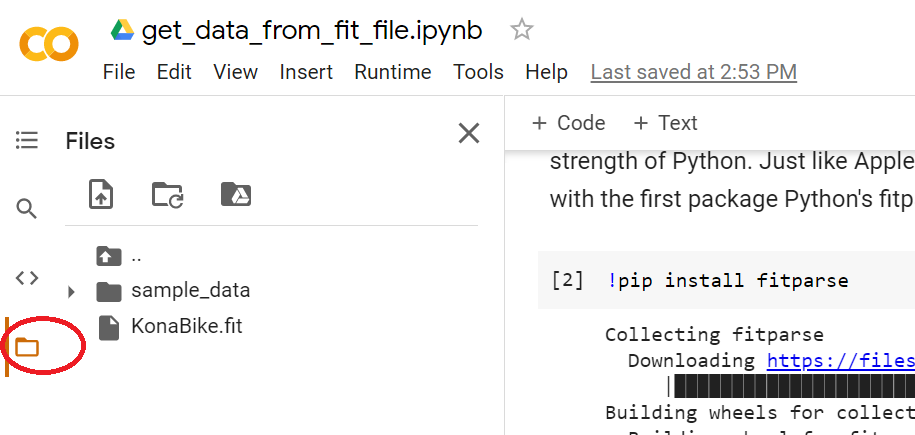
If viewing this blog in Colab, You won't see it as it disappears with each new run time but feel free to upload your own fit file and reference it in the next block of code. Just replace 'KonaBike.fit' below with the name of your file. So, let's instantiate our file as a FitFile object..
fit_file = FitFile('KonaBike.fit')
OK, cool so now we have created a variable called 'fit_file' and within this variable we've instantiated one of these FitFile objects that points to the file that we've uploaded. Now let's have a look at the data from our fit file...
for record in fit_file.get_messages("record"):
    # Records can contain multiple pieces of data (ex: timestamp, latitude, longitude, etc)
    for data in record:
        # Print the name and value of the data (and the units if it has any)
        if data.units:
            print(f"{data.name}, {data.value}, {data.units}")
        else:
            print(f"{data.name} {data.value}")
Pretty cool, eh? With just a few lines of code, we have access to all of the data in the file. Let's walk through the above code step by step..
"For record in fit_file.get_messages("record"):" Here we've introduced a really common pattern in Python - the loop. Whenever you see "For x in y" it means for that list of y things, loop over each thing in the list and call it "x". Specifically in this case, we're taking the get_messages method (that you can read about in the FitParse documentation) to grab all of the data variables in the fit file with header "record" and then list them out one by one.
As noted in the comment in the code (comments are denoted by # & are not executed - you can write anything you want after a # to help to give more details on your code): each of these records can contain multiple data sources so we throw in another loop to loop through each of the 'data' in the 'record'.
Another thing that you probably noticed is that the code is indented at different levels, with the second 'for' loop indented 4 spaces after the first. This 'nesting' is very important in the python language. In the case of loops, the things to do for each item in the loop is indented to tell Python which step to execute first, i.e. run through each item in the inner loop first and then move onto the next step in the outer loop.
Then we throw in another really common piece of code - the conditional. It goes "If" this happens do that "else" do this instead. In our case, "If" the data point has a "units" variable, print it with the units, otherwise, print it without the units.
Finally, you'll probably note something a bit different about the print statement. If we put an 'f' in front of what we want to print, we can then put variables directly in the string of text (encased in curly brackets) e.g. if we assigned a variable - name = "Alan" and we typed print(f"My name is {name}") We would see "My name is Alan".
As you can see, when we run the above code, it gives us a lot of data! But what if we only want to pull particular bits and pieces from the file? With a simple change to our if statement, let's only pull the power data..
for record in fit_file.get_messages("record"):
    # Records can contain multiple pieces of data (ex: timestamp, latitude, longitude, etc)
    for data in record:
        # Print the name and value of the data (and the units if it has any)
        if data.name == 'power':
            print(f"{data.name}, {data.value}, {data.units}")
Here we changed our if statement to only include the data that is named 'power' ("if data.name == 'power') Let's say we want to not just view these numbers but put them all in a list so we can perform some further analysis - average power, norm power, rolling averages, bins by power zone etc. Easy peasy...
power = []
for record in fit_file.get_messages("record"):
    # Records can contain multiple pieces of data (ex: timestamp, latitude, longitude, etc)
    for data in record:
        # Print the name and value of the data (and the units if it has any)
        if data.name == 'power':
            power.append(data.value)
print(power)
Here we created an empty list and named it 'power' then, in our loop, we appended each power value to that list and printed the whole thing out at the end. Now, what if we want to visualize our list? Well, there's a package for that (actually several) but let's use matplotlib. First we import it as we did for fitparse above (only, this time it has a really long name so we're just going to tell python to call it plt).
import matplotlib.pyplot as plt
Then we pass our list of power values to it, we tell it that we want a bar chart and ask it to 'show'
x = []
for i in range(len(power)):
  x.append(i)

plt.bar(x, power)
plt.show()

For matplotlib's bar chart, to plot the chart we need to tell our graph what the x values are and what the y values are. So, first of all we build a list called x and then we count through each data point (each second) in the power data and add it to that list (1,2,3,4... etc.)
Then we pass our new list of x values and power numbers to matplotlib's 'bar' function and ask it to 'show' and it plots our chart for us! With power in watts on the y axis and time in seconds on the x.
While cool & all, you're probably thinking that's a lot of work to just get data that I could easily get with a click from Training Peaks! And you're right. The real power comes not from looking at individual data points or sessions but pulling entire years or careers(!) of training together into BIG DATA sets. I'll show you how to roll through hundreds and thousands of files in exported folders next time.
Until then...
Train smart,
AC