
Ideal height weight ratios for Ironman triathletes
Alan Couzens, M.Sc. (Sports Science)
March 2nd, 2017

The start of the New Year is a time of thinking ahead, of setting resolutions and goals for the year ahead. If my gym traffic is anything to go by, for a lot of folks, these goals are fitness, & probably more specifically, body comp related. But this area of concern isn’t limited to Johnny Bagodonuts and his fellow January warriors. We athletes are just as susceptible to overindulging a little over the winter months and arriving at the New Year with a few extra pounds of fat and guilt. These feelings lead to questions – just how out of shape am I? What weight should I be – both in a ‘training weight’ and ‘race weight’ sense? I’ve written some in the past on the importance of carrying a little extra weight (& muscle) during the training season, but what of race weight goals? What sort of numbers are ‘ideal’ for Ironman triathletes?
While there has been some research on anthropometry (body measurement) norms among triathletes, a lot of that has focused on the Olympic sport of draft legal Olympic distance triathlon e.g. Ackland et al. did a landmark study back in ‘97 on anthropometric profiles of elite triathletes at the ITU triathlon World Championship in Perth. While these sort of studies provide some neat data from our sport, if we take a look at the difference in body types among the guys blasting the final 10k of the Olympics vs the guys pushing their way through the final marathon in Kona, it suggests that there may be a difference in the optimum morphotype between Ironman triathletes and our Olympic cousins. Additionally, many of these studies are relatively small in size. The study above used 19 elite male and female athletes. But, in this day and age, getting a bunch of data from a bunch of athletes, from whatever sport/s you're interested in, is just a few key strokes away.
So, that’s what this post is about – filling that data gap for Ironman triathletes by diving into the mass of real world data from a large number of truly world class Ironman triathletes to assess similarities and differences to their short course cousins. While we’re diving any way, why don’t we also look around and see how Ironman athletes’ body types compare to elite athletes in the single sports of swim, bike, run.
So, how do we pull all of this data? Well, we could google search the pro list of last year’s 2016 Ironman along with the start lists of each of the Olympics events - the men's and women's triathlon, the cycling time trials , the 10,000m track events for both genders, the 1500m and 800m swim events and then go through each, name by name, google each name with “height” and with “weight” see what results come up, look through each of those results to pull out the actual height & weight numbers, average the data and then type those numbers into a spreadsheet for each and every athlete. While my history has shown that I’m not beyond doing the above in the interests of gathering more specific knowledge about endurance sports, I can attest doing the above by hand takes a lot of time! Wouldn’t it be great if we could write a short script that does all of the above for us?
A few lines of Python code like…
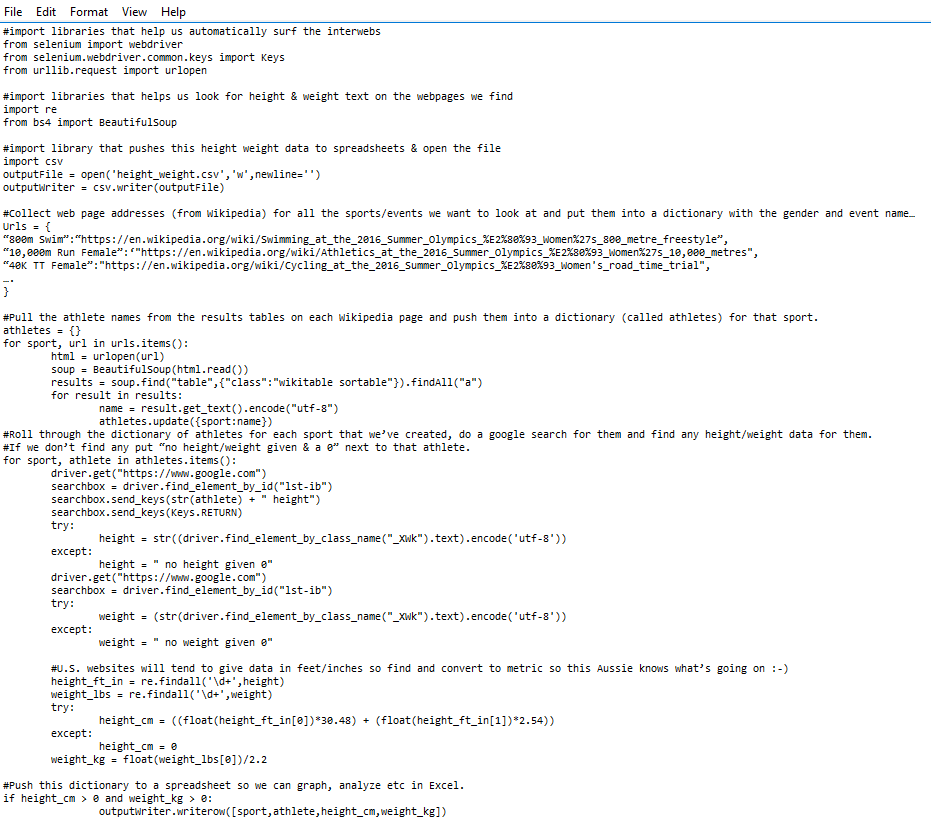
… will search through the Ironman World Championships start list along with all of the Olympians on the Wikipedia results pages for each sport given. Then it will go athlete by athlete, typing the name of each athlete from each sport into Google. It will then look through the search results google comes up with for any including height/weight data. It will then pull out the numbers from all of this height/weight data, summarize it and convert it to the ‘proper’ form (i.e. metric :-) Finally, it will push each athletes name, sport, height and weight data to a spreadsheet so that I can easily visualize the data or look at the overall stats (means, SD's etc) in more depth.
To reiterate, just in case you're sitting on the fence over the merits of learning a bit of coding, we are talking about rolling through literally hundreds of athletes, google-searching each one individually and then looking through all the resulting search results for height/weight data then transcribing the data from each athlete, each sport and each gender to a spreadsheet. And Python will do all of the above 'research' in about an hour!
In fact, if you save the above as “height_weight.py”, then type “python height_weight.py” on your command line, then go for a run, when you come back you’ll have a big spreadsheet with some nicely collated height/weight data for Ironman pro’s and Olympians in each sport & each gender that looks something like...
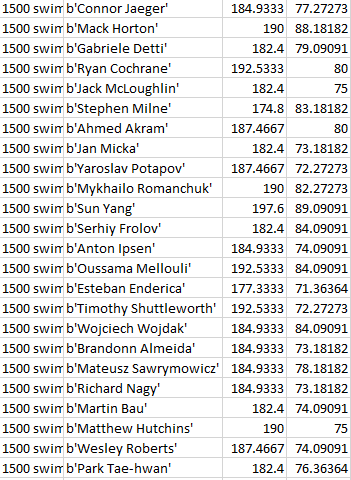
We can then very easily use this to dive deeper into the data (means, deviations, etc) and to create summary charts either in Excel or in Python's charting library - MatPlotLib (used below) to gain further insight into the patterns at hand….
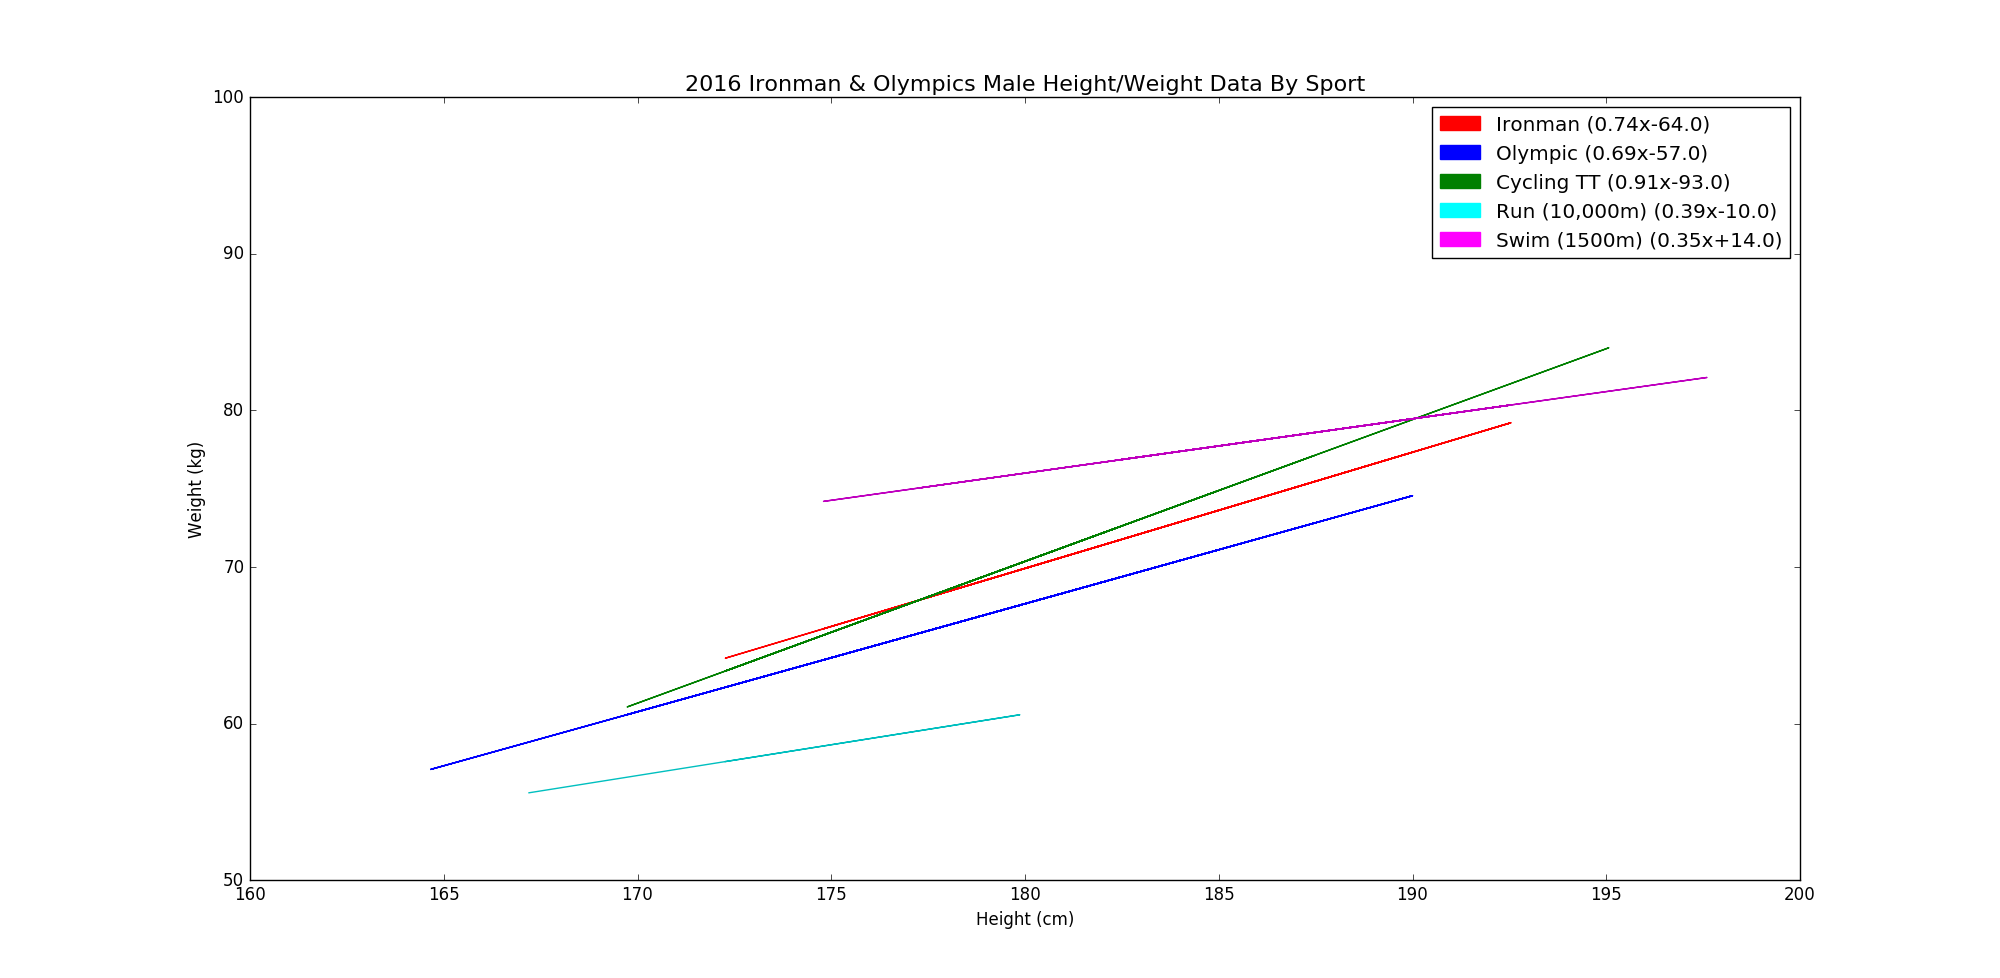
Male Data
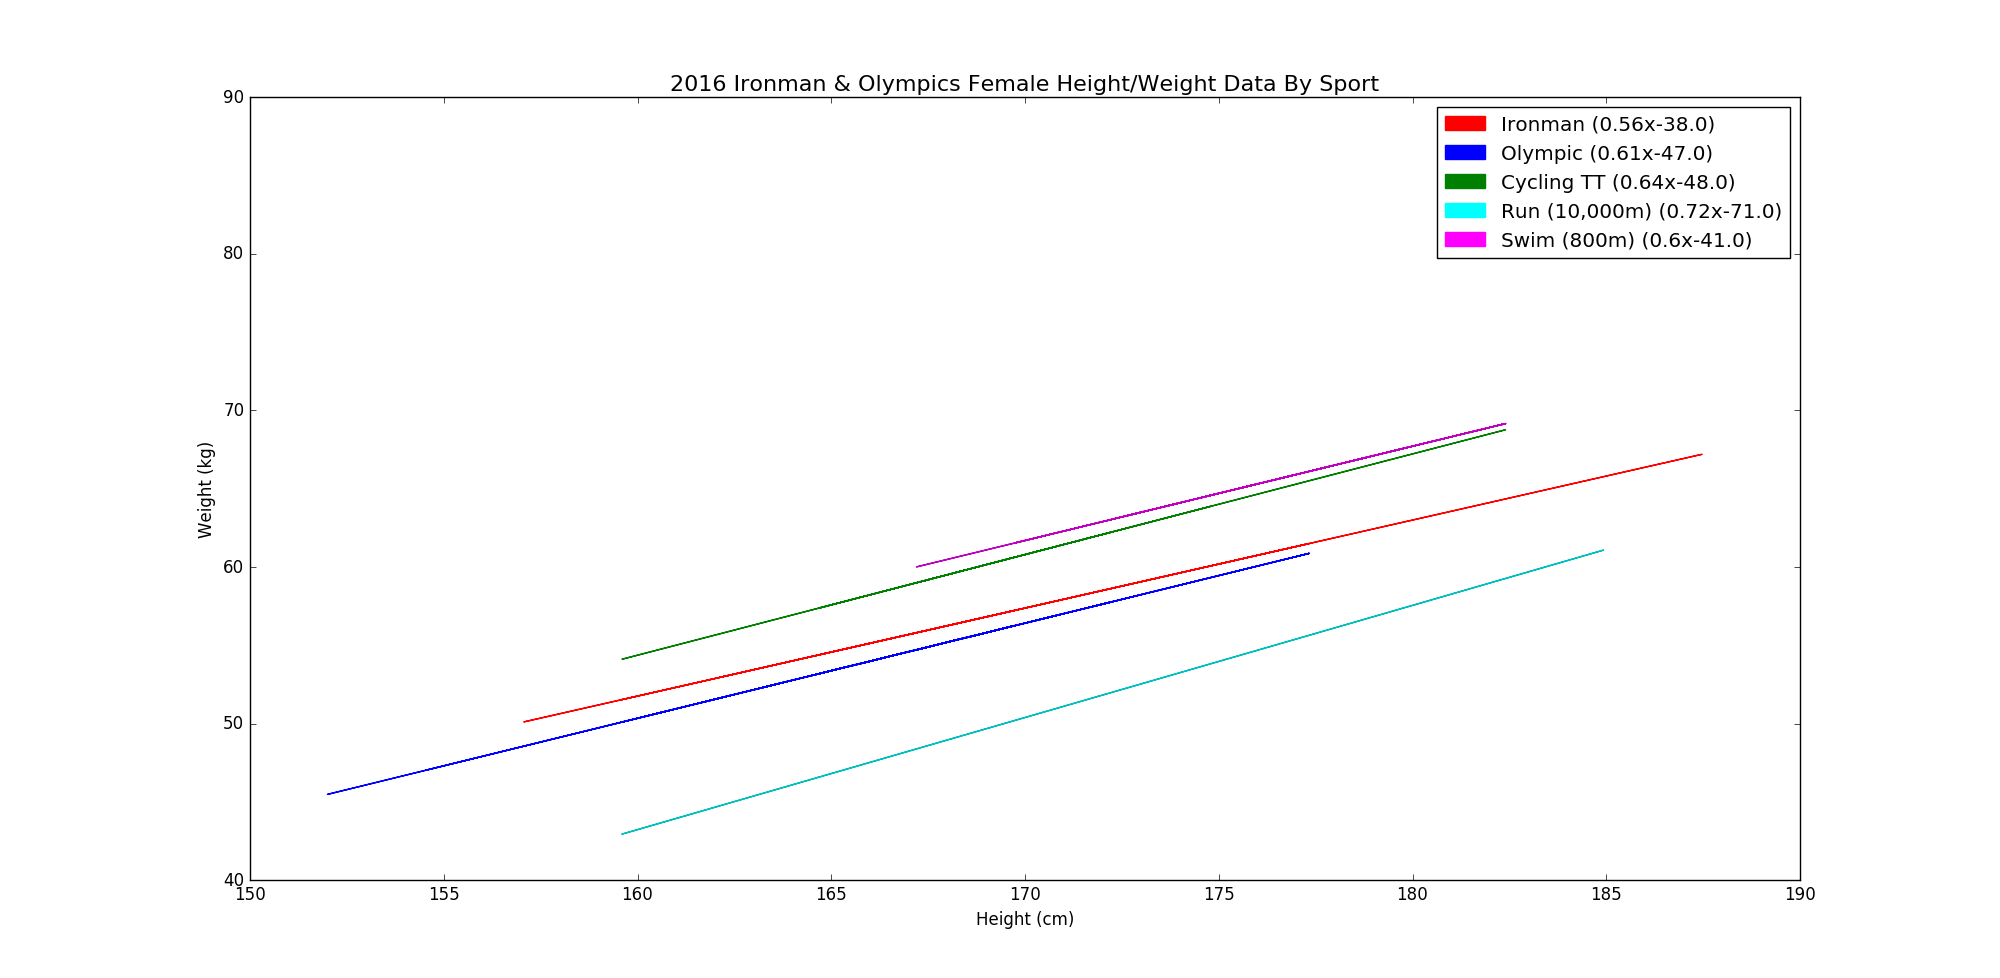
Female Data
Some key insights…
- At a mid-range height of 170cm for women, an elite swimmer is approximately 10kg (22lbs) heavier than an elite track runner (61 vs 71kg)
- This is even more the case for the men, with a difference of 17kg (~37lbs) at an average height of 180cm – 60 vs 77kg!
- Cycling was interesting, especially for the men in that, the taller the athlete, the heavier they were by a good margin, i.e. short athletes (presumably more climber specialists) were very light, while taller athletes (presumably more TT specialists) were quite heavy for their height.
- Triathlon, unsurprisingly fell in the middle of the swim->distance run extremes, with a noticeable difference between Olympic and Ironman specialties. For the men, the Olympic distance athletes were 2-3kg lighter for the same height across the board (67 vs 69kg at 180cm). A similar pattern was present for the women, though to a lesser degree - ~1kg difference at 160cm (51 vs 52kg).
- While swimming and running exhibited a narrow range of heights for the elite competitors (runners were consistently short, swimmers consistently tall), in cycling and Ironman, the range of heights among the elite competitors was quite large. The variety in terrain and, in the case of Ironman, disciplines, means that there is quite a range in the size of athlete that can be competitive in these sports.
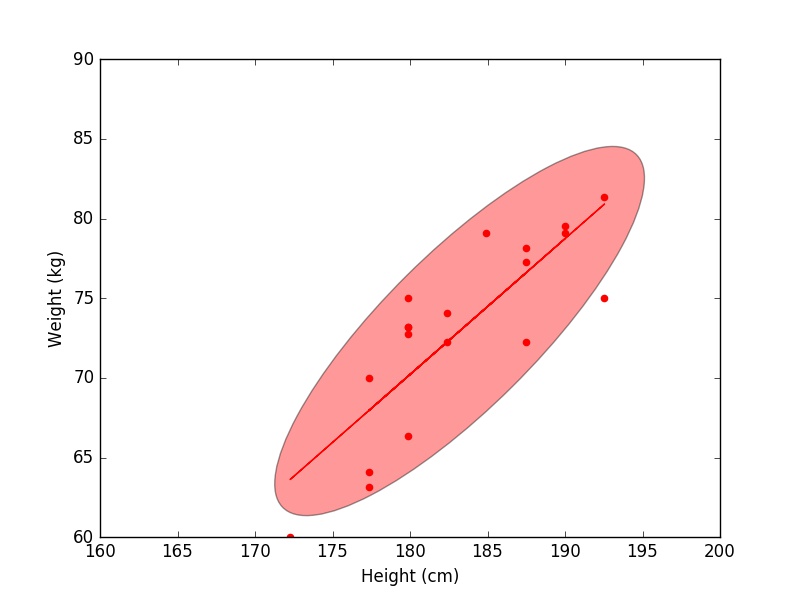
Ranges of height/weight among elite Ironman Triathletes
I'm adding this section in response to a couple of responses to this initial post that raised a very good point - shooting for a given weight without context of the athlete's frame or, to a lesser extent, muscle mass, could lead to weights that are unhealthy or too low for that given athlete. I've talked about the role of body 'frame' in other posts and, indeed, if we cast an eye across the Kona Pro field you'll find all types of 'chassis' builds - from the 'Super-Duty' bone frame of Andy Potts to the 'light compact' bone frame of a Patrick Lange. While these guys only differ by 5 inches in height, the weight difference is a mammoth 35lbs & it would be tough to argue that both are not extremely successful in their chosen sport! (though, not coincidentally, with a very different SBR mix). Long way of saying that for each height there is a range of weight where your personal sweetspot will lie. So how big is that range?
Below you'll see 95% confidence ellipses for the male and female pro's with some scatterplot data of individual points included. The 95% means that ~95% of samples will fit within these 'bubbles' (a little less than 95% for female as I removed one extreme outlier - Heather Wurtele). As you can see, in the 'meat' of the bubble, the range from edge to edge for a given height is a rather large +/- ~5kg (~10lbs). This tapers down as we get to the extremes of height. Approximately 2/3 of all samples fit within a much narrower +/- 2.5kg (~5lbs)
Male
Female
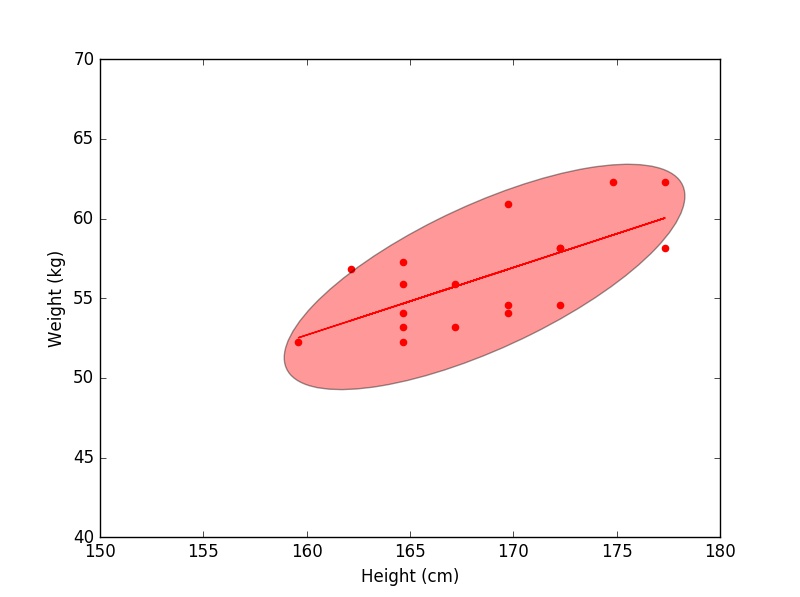
The take home being, if you have an average height & bone structure, your optimal Ironman race weight will likely fall within +/- 2.5kg(~5lbs) of the lines above. Those at more of the 'super duty' or 'light compact' ends of the spectrum, though, may find their best power/weight relationship for Ironman at as far as +/- 5kg from the regression lines above.
Additionally, it should be remembered that high level endurance athletes don't tend to publically post their heaviest off-season weights :-) Therefore, these numbers should be considered at the leanest end of the season (when bodyfat numbers are typically in the 6-7% range for the elite.) 'Winter weight' can be expected to be an additional 2-3 kg (~4-7lbs) above these numbers.
Race-weight Calculator
For my less metrically inclined readers, I built the above regression equations into an imperial calculator so you can get a sense of what the data says about elite Ironman race weight (in lbs :-) for an athlete of your height and gender..
| Gender | |
| Height: | Feet: Inches: |
Ironman Race Weight:
10,000m Run:
Olympic Tri:
Cycling TT:
Distance Swim:
We’ve covered a lot of ground and discovered a lot of additional insight, but going back to the initial qu of ideal height and weight ratios for Ironman athletes, you'll see that our final numbers line up very well with Joe Friel’s long standing recommendations (as I often find after number crunching :-) With males of typical height (5’8’ – 6’4”) at his recommended 2.1-2.3lbs/inch and females of typical height (5’2”-5’10”) at 1.8-2.0lbs/in, with taller athletes at the higher ends of each resp range.
Hopefully the above will help to add some context to your body comp goals for the year ahead and will help you arrive at the 'not too heavy', 'not too light' power-to-weight 'sweet spot' for your sport.
Train (& eat) smart,
AC
TweetDon't miss a post! Sign up for my mailing list to get notified of all new content....