
What is the optimal periodization structure for Ironman?
A machine learning answer to an age old question
Alan Couzens, M.Sc. (Sports Science)
Aug 7, 2017

Nothing elicits more confusion around triathlon training than that magical word – periodization. What does it mean? At it’s root, it’s definable enough – break the training cycle up into periods. But beyond that, confusion and conflict abounds. What’s the optimal duration of each of the respective periods? What is the optimal content of each of the ‘periods’? And what is the best order of the ‘periods’?
For example, is 'traditional periodization' (high volume, low int -> low volume, higher int.) better than 'reverse periodization' (low vol, high int. -> higher vol, lower int.)? What about block periodization? (focused emphases that rely on residual fitness) And should our pattern of progression be linear (progressing in emphases), non-linear/complex (capacities addressed concurrently) or undulating? (shfting back and forth between volume & intensity focus periods) You'll find staunch advocates and proponents for each of the above and precious little in the way of objective evidence that helps us to delineate between the real world efficacy of the various approaches in different domains.
To date, our best means of answering those questions was to look at best practices, i.e. what do elite athletes do? There has been some really good research using this approach (e.g. Stephen Seiler's research on periodization patterns of elite Orienteers) but, of course, this approach is ripe for bias, i.e. do the best use these methods because they are truly optimal or because that is just ‘what we’ve always done’? Could there be changes or even small ‘tweaks’ that we could make to make the periodized plan even better? If you’re a Coach in an elite program & you’ve had good success using a particular methodology, what’s your true risk tolerance for experimenting with these different approaches? What’s your tolerance for ‘experimenting on' already very high level athletes? Is there a better way?
Yes.
By building an accurate and representative (‘true to life’) machine learning model that allows us to simulate all kinds of different periodization structures without putting our athletes’ long term development at risk.
I’ve talked about machine learning in previous posts, but as a quick revision summary – machine learning employs various algorithms to describe input -> output relationships. In this case, input = the athlete’s training and output = their Ironman performance. So, by ‘feeding’ our algorithm a bunch of previous ‘real world’ input (training) data and output (performance) data, the machine ‘learns’ the relationships between the 2 and we are then able to model the results for unseen data e.g. volumes, intensities & periodization structures that we may be reluctant to try in real life.
The big advantage of using machine learning (as opposed to 'traditional' research) in studying real life application comes from one unarguable fact - given enough data points - "stuff happens!" :-) While we may not (ethically) design a study that has an athlete 'crashing and burning' at the end of it, in real life, 'crash and burn' performances happen and by analyzing the data patterns that lead up to these 'crash and burn' performances, we can learn a lot! The reverse is also true for those 'breakthrough performances' that surprise us all as head and shoulders above what we might have expected based on our own beliefs about the training going in. But it all begins with sifting through a whole bunch of real world data for reliable training patterns leading up to good, bad and average performances
So let’s start our quest for the perfect periodization model by feeding our algorithm some ‘real world’ athlete training & performance data. Fortunately, after being in the coaching game for a couple of decades, I have a good amount of it! And yes, a good amount of both 'breakthrough' and 'crash and burn' performances to pull from.
I pulled data for 100+ previous Ironman builds from athletes of all levels from novice to pro into a csv spreadsheet (that's more than a century of real life Ironman experience that we're extracting insight from!). Pulling the volume (in hours) and the intensity (I.F.) for each month along with the end result of that Ironman build into an array. For example…
...is an array that shows one full 10 month build for one athlete who went 9:03 in their key race. It shows month 1 at 79hrs and and an intensity factor of 0.7, month 2 at 86hrs and an I.F. of 0.72 etc….
When we feed all of the above build/performance relationships into our algorithm, we get a generalizable model that best describes all of these data points & the other 100+ similar rows of data.
In this case, I used a neural network as the algorithm of choice. I talked briefly about neural networks in this post, where I applied a neural network to look at how volume and intensity can be assessed independently (as opposed to arbitrarily wrapping them into one TSS variable) to better predict a given performance. But for a quick refresher as it applies to this context - our neural network takes each of the volume and intensity numbers for each month of data as an individual ‘node’. It then applies a random weight to each node & feeds the result to a 'hidden layer' of more nodes in the network. This hidden layer repeats the process to the next layer and so on and so forth. At the 'end of the line' all of these nodes feed their information into the output node for a prediction. This prediction is compared against the correct answer from the known training data and the errors are fed back through the network and weights are adjusted accordingly. This process is repeated until the model is 'tuned' to reality and the predictions equal or are very close to the actual numbers from the whole set of training data. In this case, my neural network had an input layer of 20 nodes (volume and intensity numbers for the 10 months leading up to the performance), 2 'hidden layers' of 50 nodes each and one single solitary node as the final output layer that gives us our performance prediction. I used a Newtonian solver for backpropogation and set the network to run through this back and forth process for a maximum of 1,000 times (click here to show the code).
I should probably note that there are even more powerful algorithms available that specialize in time sequence data like the above, i.e. data where the order matters. A Recurrent Neural Network is especially suited for the task. These more specialized versions of a neural network add an additional dimension (i.e. consider data as a Tensor) and employ a separate layer for each time step so that they maintain a 'memory' of the previous step. While superior for the task, these layers add up(!) and lead to a computationally expensive model. So we'll use a 'flat layer' approach and keep things relatively simple (for now... :-)
Once we have a solid model that is 'fine tuned' to reality, we can present it with new, hypothetical scenarios that weren't in the initial training set & have it predict what the result of that new strategy would be...
For example, we can ‘ask it questions’ like...
- (Assuming we don't get injured), how much more performance will we get if we add 100 hours of training to the year?
- What if we ratchet up the average intensity from 0.7 to 0.75 instead?
- Or, in terms of distribution, given 600hrs to work with, should we split it 300 in the first half of the year & 300 in the second or should we do more load early in the year in the base period or closer to the key race?
- Similarly, for intensity – should we do our intensity early and bring it down to more specific race intensity closer to the Ironman or should we ‘sharpen’ prior to our race?
These kind of ‘what if’ analyses are the cornerstone of ‘predictive modelling’ – the branch of math/statistics that looks to apply models to predict the outcome of various strategies. An already huge (& growing) field in the worlds of marketing, finance/trading & even medicine, and a strategy equally applicable to our own world of predicting (& optimizing) sports performance.
So, let’s put our model to the task of identifying the optimal periodization structure for Ironman athletes that gives us the best possible performance for a given load…
Let’s start by meeting the various periodization models that we want to test. In this case, I tested 7 different structures all of an equal overall average load of 50hrs per month and an average intensity factor of 0.7 but with that load distributed in very different ways across the 10 months…
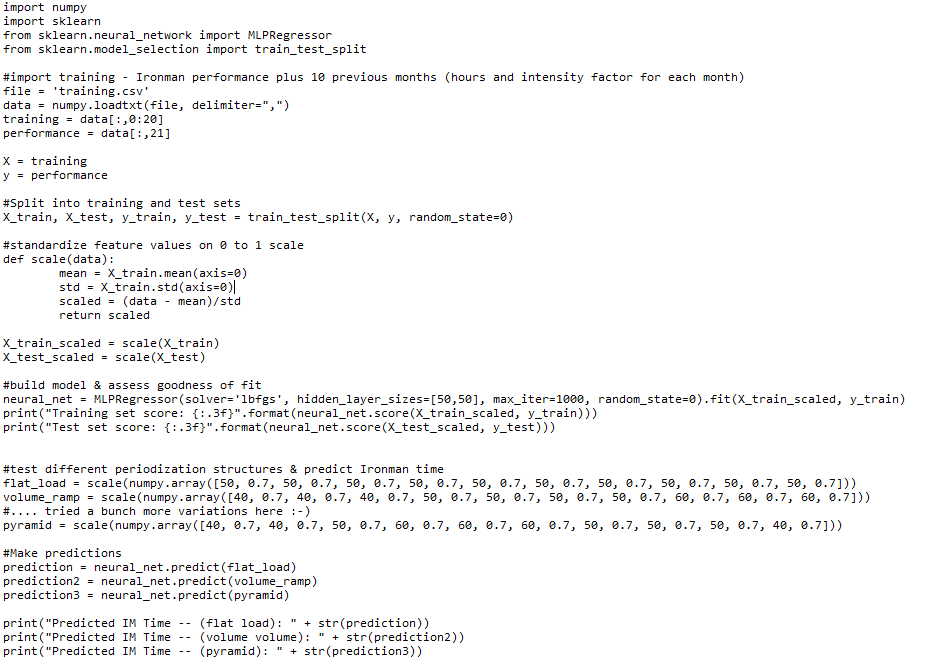
1. 'Flat Load'
A stable volume and intensity - every month at 50hrs of load and an average intensity factor of 0.7
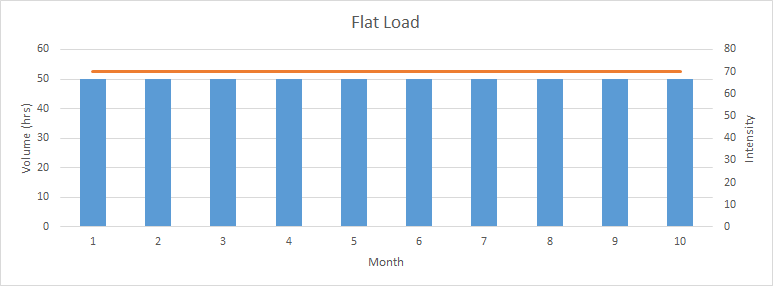
2. Volume Ramp
A progressive increase in volume from 40 to 60 hours per month abut with a stable intensity of 0.7 throughout
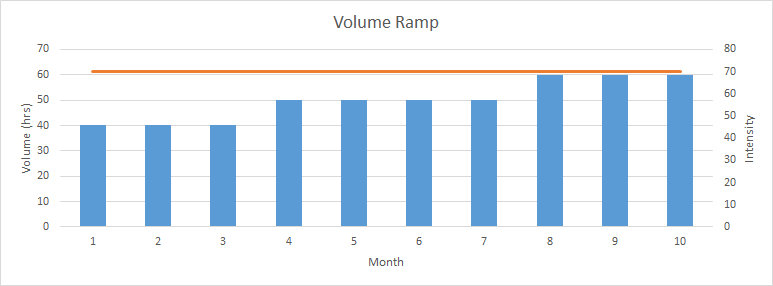
3. Volume Reverse Ramp
The opposite of the above - starting with the highest volume and progressively reducing as we get closer to the event
4. Volume Pyramid
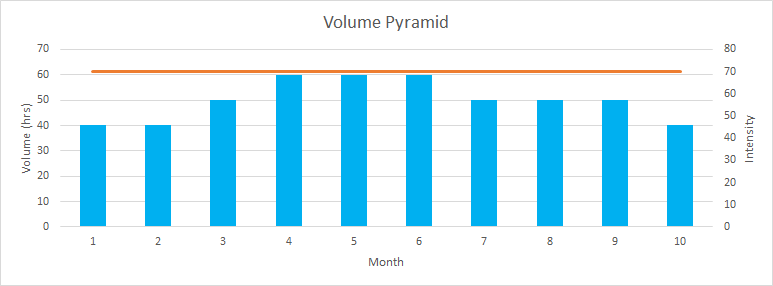
A 'pyramid' structure, where the volume starts low, progresses to a mid-year peak and then comes back down as we get closer to the event.
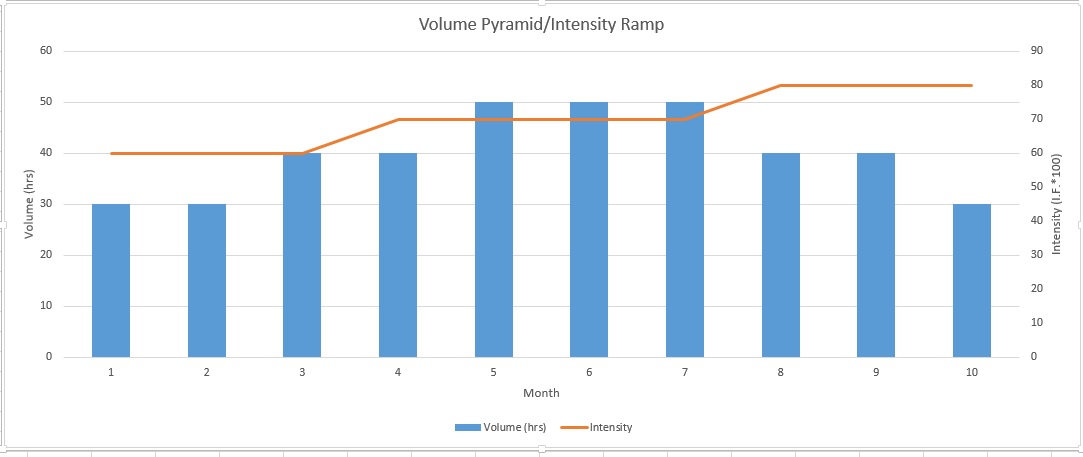
5. Intensity Ramp
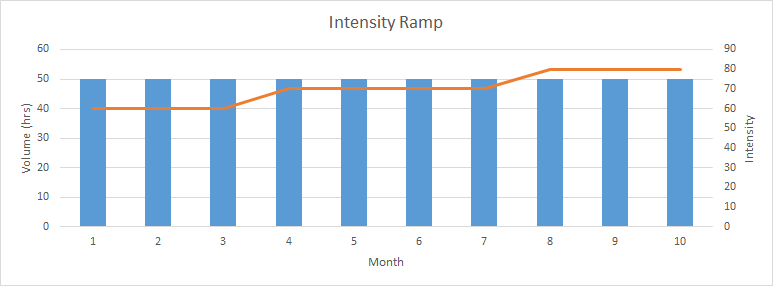
A 'traditional' increase in intensity over the course of the training year but with an even volume of 50hrs/mo throughout.
6. Intensity Reverse Ramp
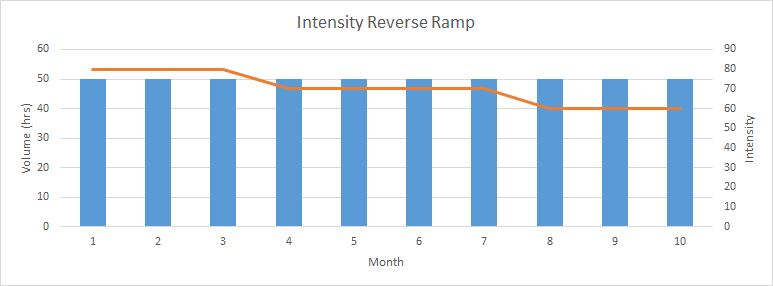
A 'reverse periodization' approach where intensity starts high (threshold/VO2 work etc) in the winter and then comes down to longer 'base' work towards the end of the year.
7. Intensity Pyramid
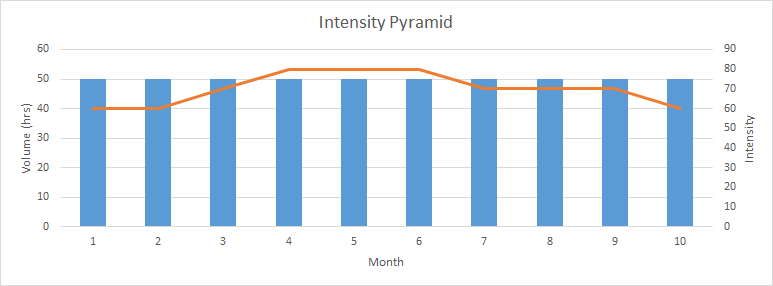
Similar to volume period, intensity peaks in the middle of the year and then reduces as we get closer to the event.
So, for the same given load (average of 50hrs/month & average intensity factor of 0.7), which periodization strategies resulted in the best & worst Ironman times?
| Strategy | Predicted Performance |
|---|---|
| Flat Load | 9:59 |
| Volume Ramp | 10:03 |
| Volume Reverse Ramp | 10:07 |
| Intensity Ramp | 9:24 |
| Intensity Reverse Ramp | 10:42 |
| Intensity Pyramid | 9:33 |
| Volume Pyramid | 9:12 |
The winner by a good margin was the ‘volume pyramid’ approach where volume starts low, builds to a peak mid season and then heads back down towards a taper.
In a close second was the intensity ramp – where intensity starts low and progressively builds throughout the year all the way to the ‘A race’.
You may be wondering, what happens if we combine these 2 winning strategies? And you know that I couldn’t resist..
Indeed the combination of pyramid volume and intensity ramp performs even better than any of the other individual periodization structures by an additional ~10 mins, with an overall best performance on that total load of 9:02
And the worst periodization model for Ironman performance?...
At more than an hour and a half slower than the optimal structure, the worse by far is the intensity 'reverse ramp', i.e. the highest intensity of the year occurring early and then decreasing as we get closer to the race. This ‘reverse periodization’ structure is advocated by many & it makes sense as a convenient way of dealing with the winter – do your intensity early and then add volume as we get closer to the Ironman. However, my data would suggest that this is a sub-optimal approach when it comes to getting the best Ironman performance from your training load. My data would suggest that the athletes who have performed best for a given training load have built their intensity through the year from very low levels in the winter to the highest levels just prior to their key event.
And, from a volume perspective, have built that also from a low level in the early season to a high level mid-prep perhaps with the implementation of training camps etc followed by a slight reduction as they build in more race pace & race pace plus training as they sharpen and taper for their key event.
##########
I have to confess that I was a little surprised by the magnitude of differences that the model predicted between the different approaches and, indeed, by how quick the predicted time for the optimal approach was! While I've certainly seen a few athletes go close to 9hrs on ~600hrs annual volume, they are definitely the exception, not the norm! However, I would also have to say that pulling off the optimal periodization plan above is equally rare! A long, uninterrupted build with a few big months strung together in the meat of the season and a progressive, consistent rise in intensity through the whole build isn't an easy thing to pull off but this data would suggest that, when it comes to optimizing Ironman performance, it is a very worthwhile ideal to strive for.
Train Smart,
AC
TweetDon't miss a post! Sign up for my mailing list to get notified of all new content....