Peaking the individual athlete:
The role of k2
Alan Couzens, MS (Sports Science)
May 9th, 2016 (Updated: Sep 24th 2018)

The majestic peak in the pic is the Himalayan mountain, K2 (it will make sense if you read on…:-)
I recently had a question from an athlete about the thought process behind individualizing tapers. I’ve written a little before on the general concepts behind tapering but anyone who has been involved in endurance sports for any time will confirm that optimal tapering is as much art as science and is very specific to the individual.
Well, as I’ve a habit to do, in this post I will at least attempt to frame the art with a little science…
The individuality behind the taper comes back to another factor that is also very individual to the athlete – training fatigue. One of the biggest (& weirdest) differences in response to training comes in the form of how fatigue manifests. Contrary to what common sense might suggest, not all athletes get visibly tired with training! In fact, some feel decidedly more lethargic when we take away the day in day out training stress & their performance numbers back this up!
The guy below, Owen Martin (pictured after winning his age group with a 9:03 in Arizona) is a good case in point….
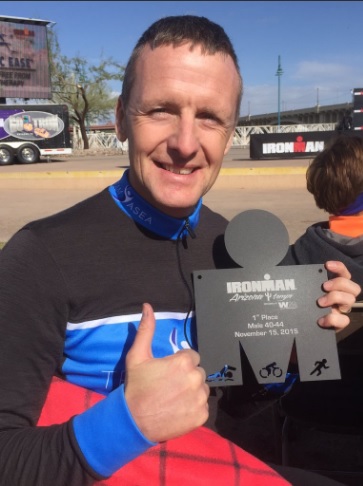
While Owen has a solid training response, the real ace up his sleeve is a killer work ethic coupled with an interesting physiological peculiarity - the man doesn’t get tired!
He can handle VERY high training loads without any signs of fatigue (both in terms of performance or perception). In fact, he thrives on it! If I didn’t have a body comp scan to the contrary, I would swear that he is part machine :-) Knowing this about him (i.e. the performance benefit he gets from high workloads), obviously affects just how much load we’re willing to shed in the taper to maximize performance on race day.
An important note (for Owen & his fatigue-resistant brethren): This doesn’t mean that fatigue isn’t entering the system. Given enough time, that grindy performance drop from cumulative fatigue still shows up, it just means that it manifests differently, on a different time scale to most. Or, put in terms of one of my favorite movie metaphors - in the early Rocky v Drago fitness/fatigue rounds, the ‘good guy’ (fitness) has the upper hand when it comes to performance.
Yes, this article is a reminder of that 'first principle' training equation…
Performance = fitness + fatigue
Or more accurately, when looking at the individual athlete…
Performance = (k1 * fitness) + (k2 * fatigue)
Where k1 & k2 (sometimes called kf & ka in the modeling literature) equal the individual fitness and fatigue weighting coefficients that are specific to the individual athlete.
For those interested in delving into the math of the athletic 'dose-response' model in a little more depth, a great starting point is this classic paper by some of the founders of applying mathematical modelling to predict athletic performance - Hugh Morton, John Fitz-Clarke & Eric Bannister
I talked about the individual athlete differences in the first of these ‘weightings’ (k1) in a previous post on 'training responders'. In this one, I want to cover the second because it has strong implications on just how we go about individualizing the athlete’s taper. For this one we want to answer the question - are you a ‘fatigue responder’?
The relationship between an athlete’s k1 & k2 determines “how much freshness is equal to a pound of fitness?” Or, more practically, with regards to taper, how much fitness do I want to give up in the name of getting more fresh? And the follow up questions: With this in mind, how long should the taper be and how much should I decrease the training load for this athlete?
The only way to go about systematically answering these questions for an individual athlete is to monitor them and collect data under conditions of both high fatigue and high freshness to see how each affects performance.
Fortunately, that’s the name of the game when it comes to structuring a block of training! We progressively add load to make the athlete more fatigued over the course of several weeks or ‘microcycles’ & then we unload this fatigue and let freshness ‘bounce back’ during a recovery period. Because we have lots of these training blocks over the course of a season, we have lots of opportunities to track the athlete under both high and low fatigue conditions. By tracking the athlete’s numbers over the course of these training blocks/mesocycles, we can get an idea of just how this athlete responds to training with respect to both fitness and fatigue.
For example, we might include a regular set in each week of training at a prescribed heart rate range and watch how power numbers change over the course of a block.
Examples of the different patterns that we might see over the course of these test sets for athletes of differing 'fatigue response' are shown below…
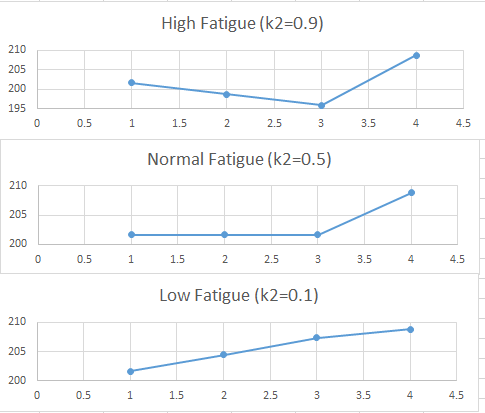
with time in weeks over the course of a training block shown on the x axis and average power from the test set shown on the y axis
Example 1 is what we typically think ‘should’ happen over the course of a training block – athlete gets tired, numbers drop off as the athlete is loaded and then ‘super-compensate’ beyond the initial level when we recover. However, in real world observation of athletes, this doesn’t always occur. Sometimes (as in the case of Owen with a k2 of 0.1), we see the last example, where despite increasing fatigue over the training block, the athlete’s fitness contributes relatively more and performance numbers steadily increase.
These different patterns observed in training, have obvious implications to individualizing the taper when we’re looking to ‘fiddle with’ loading and unloading to give the athlete the highest possible numbers on race day.
If we’re dealing with a ‘high fatigue’ athlete we will want to taper more aggressively, as freshness is worth more than fitness to this athlete. On the other hand, if we’re dealing with a ‘low fatigue’ athlete, we will want to carry more fitness into the race, as, for this athlete, a pound of fitness is worth more than a pound of freshness. In the case of Owen, 2 weeks out from his Arizona win he was throwing down an 1100TSS training week!
These differences in response to the same taper are shown in the scenario below….
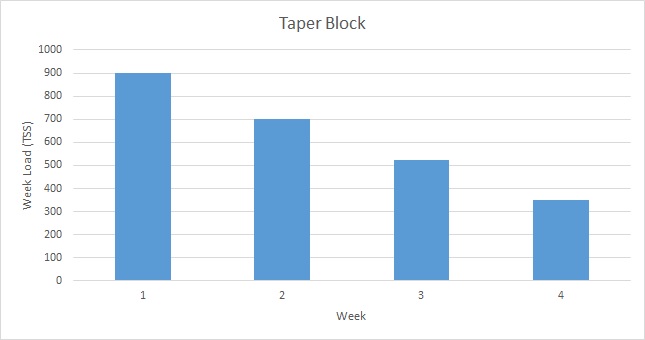
In this case, a pretty typical Ironman taper – an athlete comes in after the last loading week (of ~900TSS) with a CTL of 100 and a TSB of -20. The first week (3 out) is a maintenance week of 700TSS. 2 weeks out, the load drops by ~25% to 525TSS. In race week, load drops by an additional 25% to ~350TSS pre race.
So how do our various athlete types respond to the above taper?
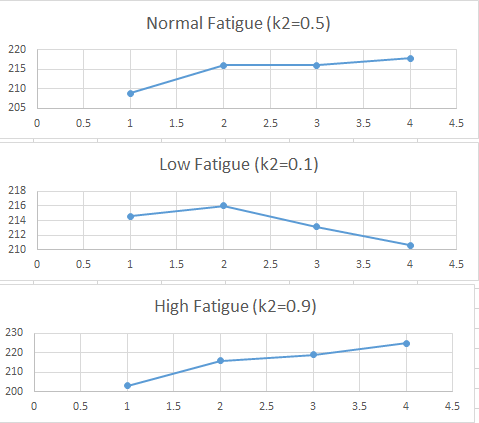
Athlete 1 (‘normal fatigue’)– Gets a big boost from the first recovery week and a still positive but decreasing benefit for each week thereafter. For this athlete a 2,3 or 4 week taper all work pretty well.
Athlete 2 (‘low fatigue’) – Gets a slight performance benefit up to week 2 but then it turns into a decrement if the rest is prolonged. For this type of athlete, you need to be careful not to ‘over-taper’ them.
Athlete 3 (‘high fatigue’) – Gets a lot of benefit from the taper. In this case, almost 20W(!) from the 4 weeks of recovery. A good, long taper is essential to this type of athlete performing well.
Given the differences above, the important follow up question becomes...
How do I work out what category I fit into and what taper strategy will be optimal for me?
While a coach may certainly take a more ‘artistic’ approach to the problem at hand by observing how athletes perform in races using different tapering strategies, for athletes who specialize in long course events, the opportunities to 'test out' different approaches are few and far between & this often leads to athletes/coaches getting the taper wrong for key events! For this reason, we can significantly speed up the learning process by applying modeling to ‘watch’ the athlete not just in races but over the course of each training block. TrainingPeaks takes care of the load aspect of the modeling already with the tracking of Fitness (CTL) and Form (TSB) on their Performance Management Chart. We can easily compare how these 2 features independently impact a given performance test measure - like the the athlete's VO2 Score from submaximal aerobic benchmarks sprinkled through the build (under high and low fatigue conditions) to determine the athlete's k2 number and just how much relative performance benefit this athlete gets from fitness and freshness. This calculation amounts to just a few lines code...
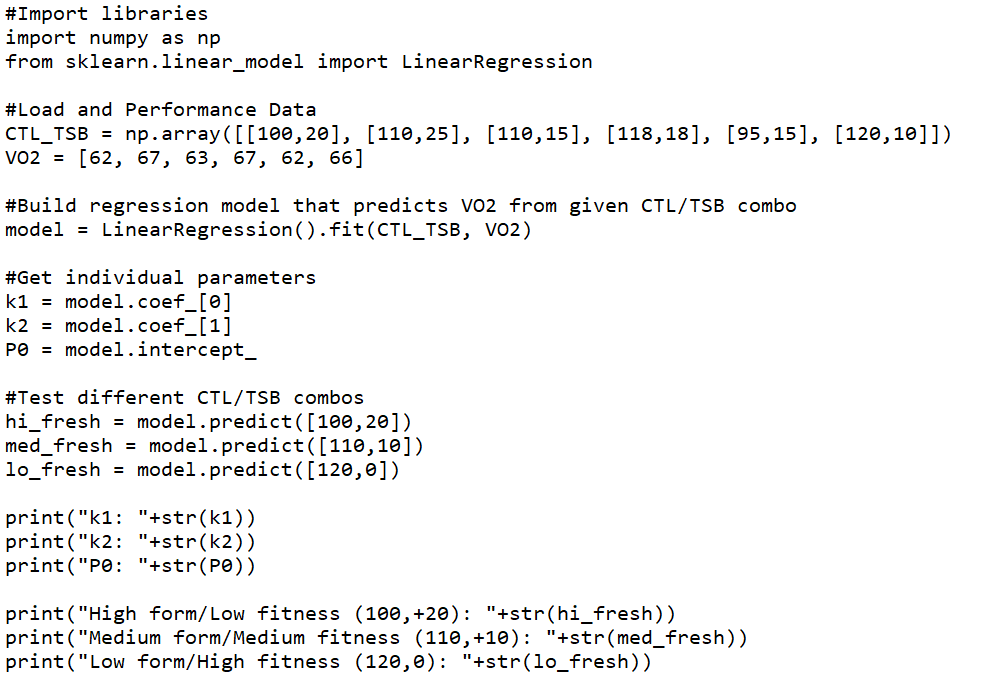
In the above script, we provide observed load (CTL, TSB) data from a given athlete, along with the performance output at that time (in this case, VO2) for a number of different test performances. Then we build a simple linear regression model that we fit to the data and we pull the (k1, k2) coefficients from the model. We then 'take the model for a test drive' on a few different hypothetical tapering strategies for this athlete that yield different CTL/TSB combo's. The output is as follows..
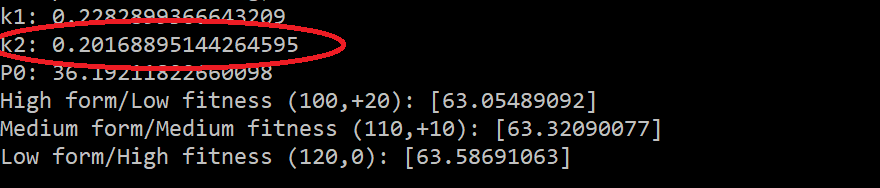
The second coefficient (circled) i.e. our coefficient on the TSB variable, amounts to the athlete's k2 - i.e. the weight of response they get from freshness (higher TSB). As the above scenarios show, this number provides very useful information when deciding the taper length and overall strategy, with lower k2 athletes benefiting more from a short taper and continued work closer to the event and higher k2 athletes seeing greater benefit from longer tapers that amount to higher TSB numbers. As shown above, we can even take it a step further and test out these different strategies...
In the script above, we applied this individual athlete's model to a high form/low fitness (CTL=100, TSB=20), medium form/medium fitness (CTL=110,TSB=10) and low form/high fitness (CTL=120, TSB=0) approach. For this low fatigue athlete, with a k2 of 0.20, a similar profile to Owen above, the model predicts that their highest performance will come from carrying a high amount of fitness into the event and opting for a shorter, less aggressive taper (just enough to get TSB to zero). For an athlete with a higher k2, the best performing taper strategy will change, with more benefit coming from a higher TSB approach.
While the absolute differences between the different taper scenarios for this athlete are relatively low - in the range of 1% (2-3 Watts @ typical Ironman outputs), for more fatigue affected athletes (athletes with k2's closer to 1.0), the performance difference between different strategies can be in the range 10%, or in Ironman terms - 20 to 30W when wrong tapering strategy is used!
By utilizing the above process of individualizing the taper to the athlete based on their previously observed relationship between fitness, form and performance, we can minimize the risk of screwing up this all important phase of the season and add a little science to the art of optimizing the taper for the individual.
Train smart,
AC
TweetDon't miss a post! Sign up for my mailing list to get notified of all new content....