
Beyond Training Load:
Are you a volume or intensity responder?
Alan Couzens, M.Sc.(Sports Science)
Aug 21, 2018
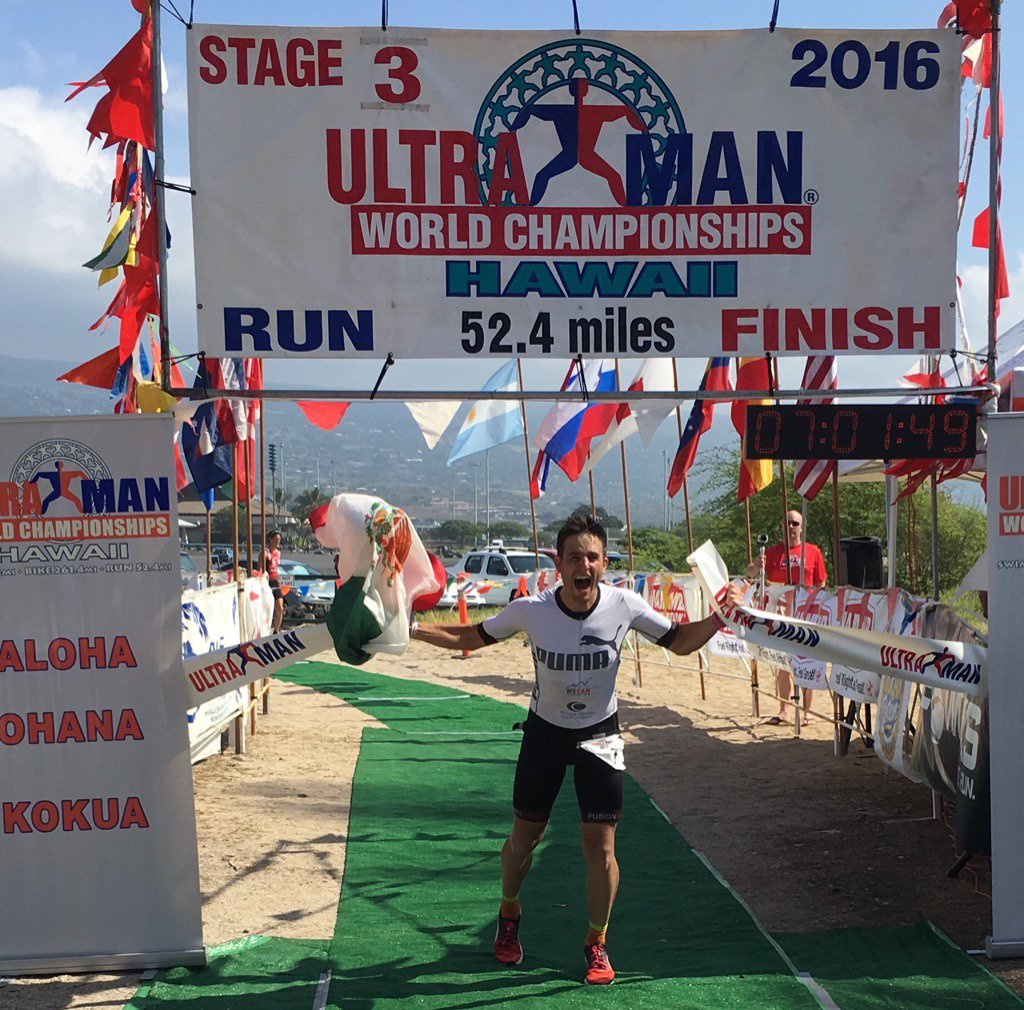
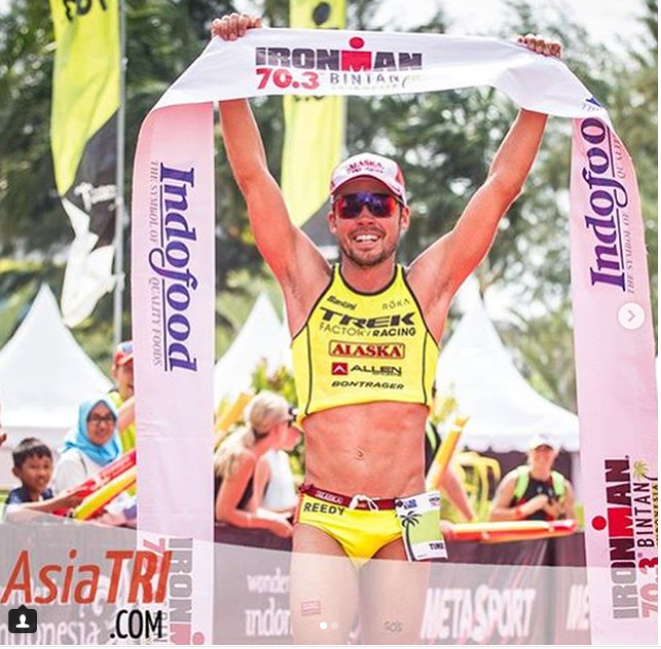
The further along I get in this coaching journey and the more different types of athlete that I have the opportunity to work with, the more truth I find in the principle of individuality. For instance, take the above photo: 2 athletes obviously doing well (Inaki De La Parra is pictured winning the Ultraman World Championship. Tim Reed is pictured winning last week's Bintan 70.3 race) but off very different types of training.
Inaki is very much a volume responder. His fitness changes almost directly proportionate to the training hours. Tim, on the other hand is much more of a ‘intensity responder’. He gets a lot of fitness ‘bang’ from blocks of higher intensity (though still largely aerobic) workouts.
If I was to deliberately switch it up (or just make an error in my uploads for the week :-) and give Tim Inaki’s training and give Inaki Tim’s training, despite the training being perhaps similar from a TSS perspective, I am statistically confident that the end result would not be good!
This brings us to the point of this post…
Looking purely at training load (TSS) is, in my experience, a grossly over-simplified way to assess training 'dose'. In order to maximize our athlete's chance of improving/responding to our training plan, it is essential that we take it that one step further and look at how athletes respond independently to different doses of both volume and intensity
So, how do you find out which camp you belong to & the right mix for you?
In a previous post, I asked the question “are you a training responder?” and outlined how you might go about assessing the rate at which your fitness changes for a given load. In modelling parlance, calculating your ‘k1 coefficient’. However, as the above alludes, this only goes part of the way as not all load is created equal!
In my last post I talked about some of the limiters to the Banister/TSS model. One of these limiters is that the model attempts to wrap volume and intensity together into one single metric (TRIMP in the original model & TSS in later iterations). However, in reality, this turns out to be an overly-simplistic view of things because, as we all know, in the real world, an hour time trial at max effort and 4 hours of noodling are very different things even though they can amount to the same TSS!
It comes as little surprise then that simply by separating volume and intensity back into 2 independent variables, we can significantly improve the predictive ability of our performance model.
So, this is the first step in determining how you respond to the 2 independent forces of volume and intensity - to actually separate training load back into these 2 variables and see the impact each has on a given performance measure. Even by using a very simple model, like linear regression (e.g. via Python's scikit-learn library - as shown below or even manually via Excel!) we can see how these 2 forces impact performance & use that information to better tailor the training to the individual athlete.
For instance, let’s look at the following data sets representing a 6 month training build for 2 elite triathletes.
Athlete 1
| Block | Volume (hrs) | Intensity (TSS/hr) | Performance (VO2) |
|---|---|---|---|
| 1 | 60 | 50 | 65 |
| 2 | 91 | 55 | 70 |
| 3 | 100 | 52 | 74 |
| 4 | 110 | 52 | 77 |
| 5 | 119 | 50 | 77 |
| 6 | 116 | 53 | 80 |
Athlete 2
| Block | Volume (hrs) | Intensity (TSS/hr) | Performance (VO2) |
|---|---|---|---|
| 1 | 60 | 49 | 78 |
| 2 | 75 | 49 | 79 |
| 3 | 78 | 55 | 81 |
| 4 | 85 | 64 | 83 |
| 5 | 90 | 60 | 82 |
| 6 | 70 | 70 | 85 |
Each row represents a 28 day block of training, with total volume (in hours), average intensity (in TSS/hr) and the fitness level (VO2 score) that the athlete achieved at the end of the block.
If we were to calculate the TSS of each block and plot TSS/d vs performance for each, we’d have the following chart…
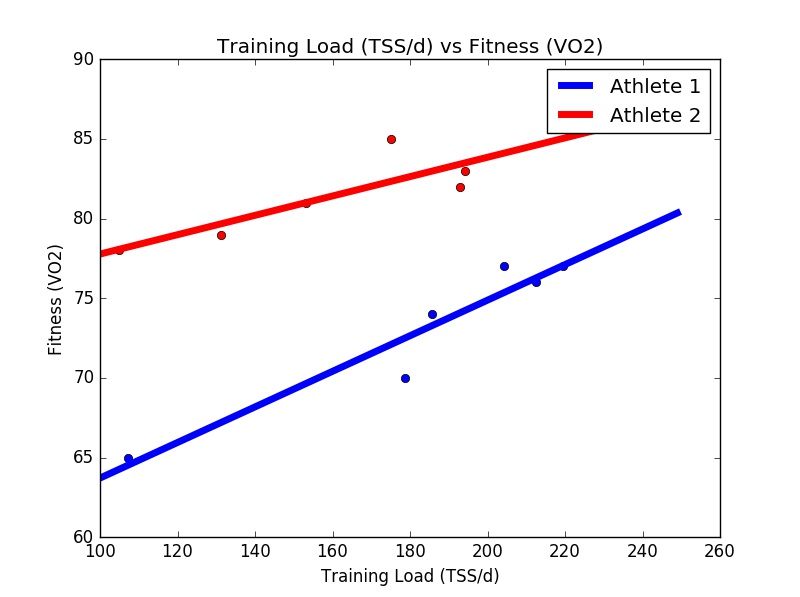
The trends for each athlete are quite clear. Athlete 1 has a lower ‘baseline’ level of fitness but gets more fitness ‘bang’ per TSS ‘buck’, i.e. the gradient of the line is steeper. Athlete 2 has a higher ‘resting’ level of fitness but doesn’t get as much response from the load.
We see a similar (but even more pronounced) pattern when we look at the trend lines for training volume….
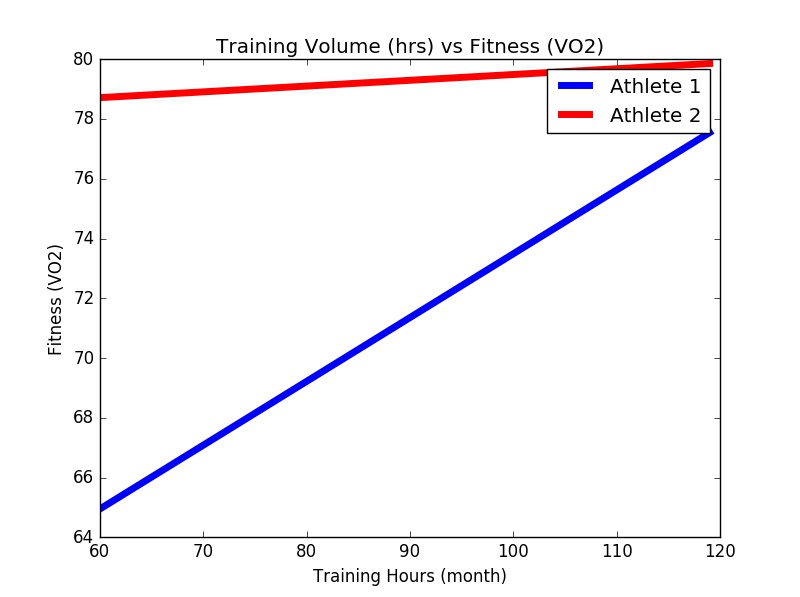
With Athlete 1 getting a big boost from every additional hour of training volume in a block and Athlete 2 not getting a whole lot of additional benefit at all (and potentially a lot more risk as I have observed when looking at load/injury relationships)
From this, we might conclude athlete 1 is a higher ‘responder’ to training. But, the question remains, what type of training? Let’s take it a step further and look at the trend lines for the impact of the average intensity of the training block on performance
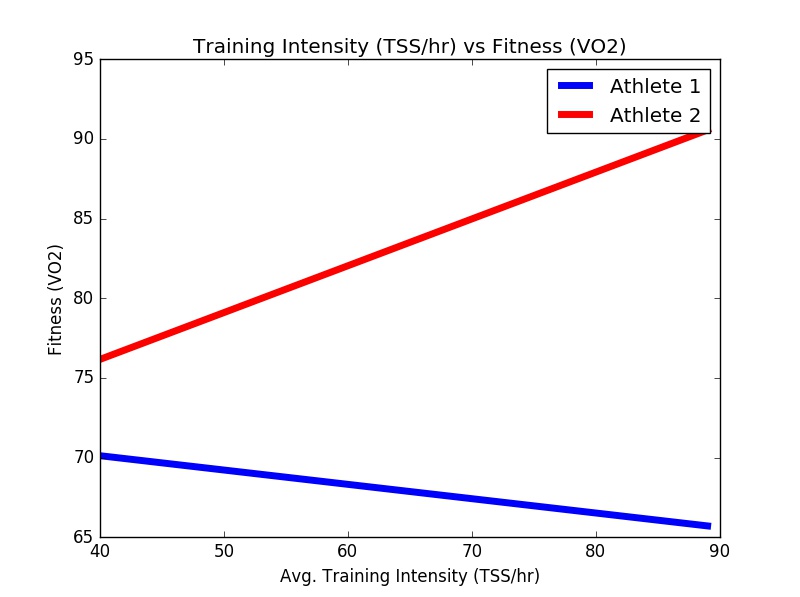
It seems the tables have turned – this chart shows a really steep positive grade for Athlete 2, indicating they are getting a significant benefit from each increase in intensity, while Athlete 1 actually exhibits a negative response to increasing intensity within the plan!
With ~15 lines of Python code, we can even use the above data to predict just how much gain each athlete gets from respective increases in volume vs intensity e.g....
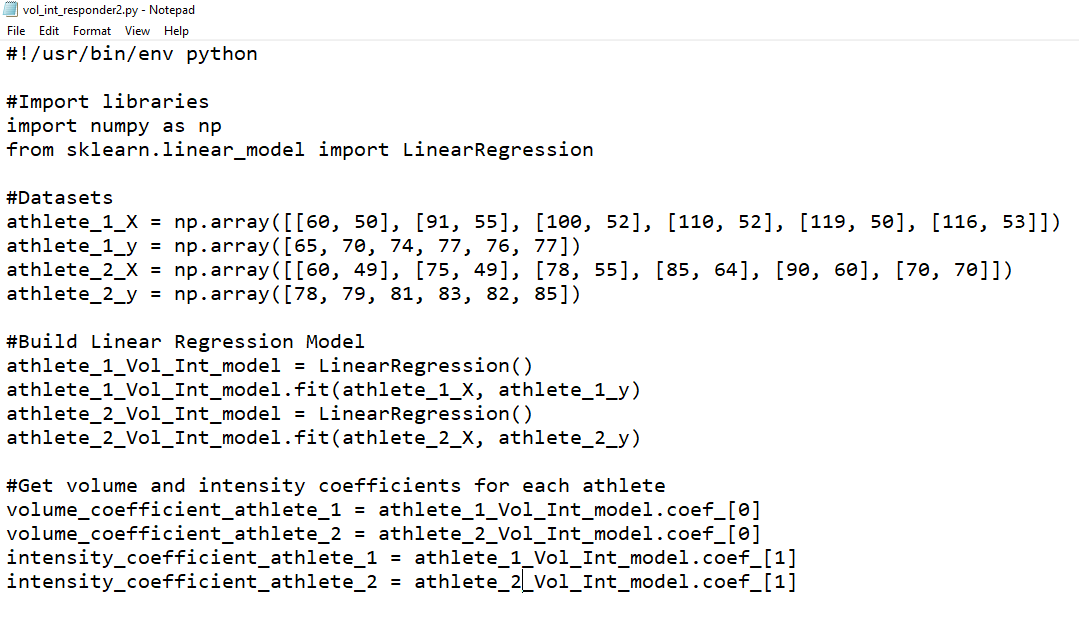
The above code builds our specific athlete models and then we can use scikit-learn's .predict() function to test out some different volume/intensity options for each athlete to find the optimal volume/intensity combo for each...
athlete_1_Vol_Int_model.predict([70,50]) #Athlete 1: 70 hours @ 50TSS/hr
>>> 67.1
athlete_1_Vol_Int_model.predict([50,70]) #Athlete 1: 50 hours @ 70TSS/hr
>>> 61.0
athlete_2_Vol_Int_model.predict([70,50]) #Athlete 2: 70 hours @ 50TSS/hr
>>> 78.9
athlete_2_Vol_Int_model.predict([50,70]) #Athlete 2: 50 hours @ 70TSS/hr
>>> 84.4
In the above, we are looking at blocks of the same total load (70*50 = 3500TSS) but with different volume/intensity configurations. Option 1 - 70hrs at 50TSS/h and option 2, 50hrs at a higher intensity of 70TSS/hr. We can see how the decision of whether to structure this as a high volume or intensity block makes a big difference to the predicted performance for each athlete, with athlete 1 doing much better on a high volume approach (pred VO2 of 67.1 when doing 70hrs @ 50 TSS/hr vs a predicted VO2 of only 61.0 with the high intensity approach of 50hrs at 70TSS/hr) and athlete 2 doing much better with the reverse approach, where intensity is favored. Same overall training load but very different performance for a volume or intensity emphasis!
Clearly, this sort of information would be good to know (!) & has very practical implications in decision making within the context of the individual training plan!
While, obviously a simplified data set to illustrate the concepts, when these training blocks start to accumulate over multiple seasons, these patterns become more and more evident. I use a 'live' model for my athletes that runs the above volume/intensity coefficient calculation and continually updates these coefficients with each training block. This allows me to keep a constant eye on the relative benefit of an increase in volume vs an increase in intensity for each athlete. E.g...
Vol-Int Linear Model Parameters:
Volume Coefficient: 0.02
Intensity Coefficient: 0.29
P0: 63
#Volume Responder
Vol-Int Linear Model Paramters:
Volume Coefficient: 0.21
Intensity Coefficient: -0.08
P0: 56
And the above pattern of some athletes really not exhibiting any fitness benefit from additional intensity (above the aerobic threshold) and others seeing continued benefit up and into the moderately-hard zone is a relatively common one. The below scatter shows the relative volume vs intensity response plotted against each other among my sample of athletes
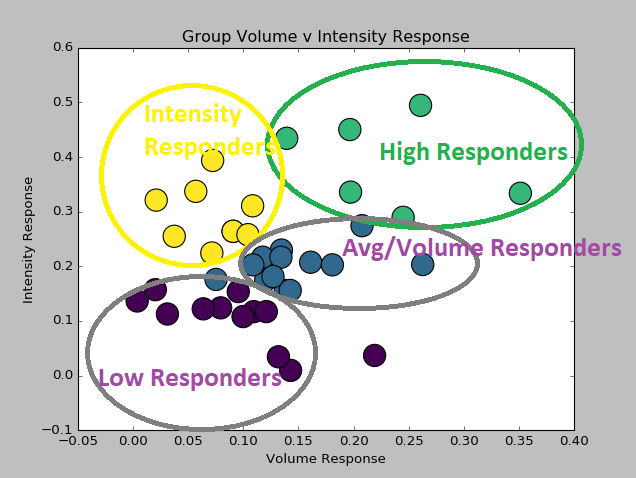
From the cluster analysis, we can see that 8/40 athletes (20%) are 'intensity responders' with a volume coefficient of less than 0.1 but an intensity coefficient of greater than 0.2. On the flipside, for the 'volume responders' - 10/40 athletes (25%) have a volume coefficient greater than 0.1 but an intensity coefficient less than 0.25.
Clearly, in order to ensure that an athlete continues to respond/adapt to the program, it becomes important to determine which cluster you (& your athletes) belong to. TSS alone won’t give us the answer to that question.
As I pointed out in last week’s post, using linear models like the above has some limitations. The predictive ability of the above approach is improved even further when we incorporate ‘bendy’ non-linear models like Neural Networks. And it is improved even more when we start to look at cumulative months of training together, especially in a sequence (e.g. by implementing a powerful Recurrent Neural Network model). But even the simple act of separating out volume and intensity into their own independent variables is a powerful first step in building a better model for your athletes and determining whether they, as an individual athlete, respond best to increased volume or intensity in the training program.
Given these individual patterns that I've been observing, coupled with the fact that, in this day and age, we have easy access to much better models & more powerful hardware than Banister ever did (the appendix to his original paper has instructions on how to calculate the metrics on a pocket calculator! :-), it's this Coach's opinion that it's high time we move away from TSS as a global measure and start to appreciate (& monitor) volume and intensity as 2 independent stimuli - each very different but each equally important in a specific context for a specific athlete.
Train smart.
AC